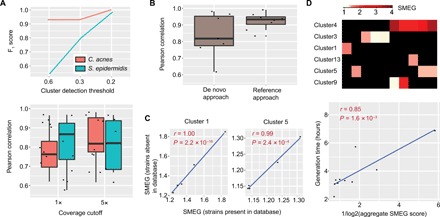
Fig. 2. SMEG accurately detects strains and measures replication rate.

(A) F1 scores for both C. acnes and S. epidermidis, reflecting precision and recall, at several cluster detection thresholds from a 30-sample synthetic mock community containing eight strains of each species. The boxplot below shows the Pearson correlation between SMEG scores and expected PTR at 1× and 5× coverage cutoffs of strain abundance. (B) Pearson correlation between SMEG scores and expected PTR using both de novo and reference-based approach at a 5× coverage cutoff using the C. acnes dataset as in (A). (C) Pearson correlation between SMEG scores and expected PTR in a five-sample, high-complexity CAMI dataset spiked with synthetic C. acnes mock from two strains missing in the species database. (D) Heat map showing SMEG scores for S. aureus clusters. Each column in the heat map represents a sample, while black boxes indicate the absence of a cluster. The scatter plot below shows the Pearson correlation between S. aureus generation time and aggregate SMEG score.
