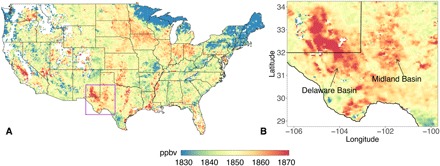
Fig. 1. Satellite observations of the Permian methane anomaly.

TROPOMI satellite data derived elevation-corrected column methane mixing ratio for (A) the conterminous United States and (B) the Permian Basin containing the Delaware and Midland sub-basins. White shading represents missing data. Purple boundary in (A) indicates the study domain encompassing the Permian Basin. Methane averages are computed from monthly means of TROPOMI measurements during May 2018 and March 2019.
