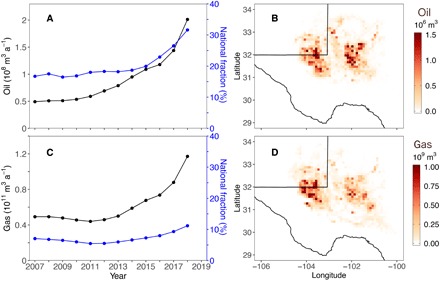
Fig. 2. Oil and gas production in the Permian Basin.

(A and C) Time series of annual O/G production in black and the corresponding fractions of total U.S. production in blue [data from the Drilling Productivity Report by EIA (13)]. (B and D) Spatial distribution of oil and gas production for 2018 [data from Enverus Drillinginfo (50)]. Oil production includes both crude and condensate production. Gas production represents gross (before processing) gas production.
