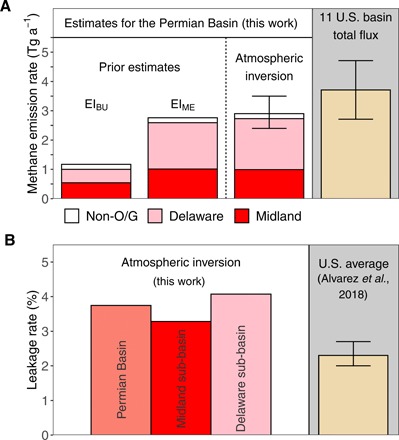
Fig. 4. Methane emission quantification for the Permian Basin.

(A) Annual methane emissions from the Permian Basin from two prior emission inventories (EIBU and EIME), and TROPOMI satellite data–based atmospheric inversion and a mass balance method. The breakdown for Delaware, Midland, and non-O/G sources is shown in pink, red, and white for EIBU, EIME, and atmospheric inversion, respectively. The estimate for the Permian Basin is compared with total emissions from 11 U.S. basins reported in literature (7, 24, 25) (table S1). (B) Leakage rates for the Permian Basin and two sub-basins, in comparison with the average leakage reported for the entire United States (7).
