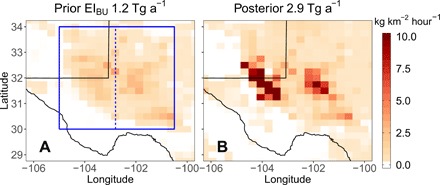
Fig. 5. Spatial distribution of methane emission rates in the Permian Basin.

(A) Bottom-up emission inventory EIBU extrapolated from EPA greenhouse gas inventory data (prior). (B) TROPOMI observation–derived emissions using Bayesian atmospheric inverse modeling (posterior). The prior and posterior basin-total emissions, indicated on top of the figure, are computed over the area enclosed by the solid blue boundary, with contributions from two sub-basins, the Delaware (left of the dashed line) and Midland (right of the dashed line).
