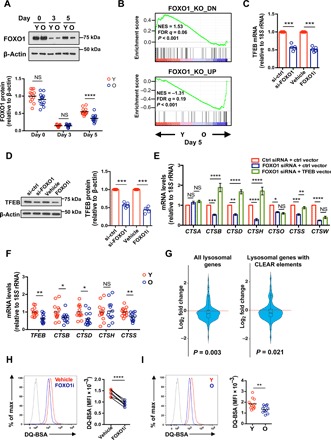
Fig. 1. Age-associated failure in FOXO1 reexpression impairs lysosomal function in naïve CD4+ T cell responses.

(A) Naïve CD4+ T cells were activated with anti-CD3/anti-CD28 beads. FOXO1 protein expression was determined by Western blotting. Representative Western blots of cells from one young (Y) and one old (O) adult and summary data from 13 young (20 to 35 years old) and 13 old (65 to 85 years old) healthy individuals. Intensities of FOXO1 protein expression were normalized to β-actin and are shown relative to the mean of unstimulated naïve CD4+ T cells from young individuals. The horizontal lines represent mean values; comparison by two-tailed unpaired t test. NS: not significant. (B) GSEA comparing fold transcript differences in young compared with old naïve CD4+ T cells on day 5 after stimulation (accession number: SRA: SRP158502) (19) with that of mouse Foxo1 knockout (KO) unstimulated T cells (46). NES, normalized enrichment score; FDR, false discovery rate. (C) Naïve CD4+ T cells from a young healthy adult were activated with anti-CD3/anti-CD28 beads, transfected with FOXO1 or control siRNA on day 2, and then cultured on plates coated with anti-CD3 (5 μg/ml) and anti-CD28 (5 μg/ml) antibodies. Alternatively, naïve CD4+ T cells were activated with anti-CD3/anti-CD28 beads; vehicle or 50 nM FOXO1 inhibitor (AS1842856) was added on day 3. TFEB mRNA was quantified by reverse transcription polymerase chain reaction (RT-PCR) on day 5 of culture. Results are normalized to control-silenced or vehicle-treated cells; mean of five experiments; two-tailed paired t test. (D) TFEB protein expression in cells treated as described in (C) was determined by Western blotting. Representative blots (left) and relative intensities, normalized to control samples (right), are shown; mean of five experiments, two-tailed paired t test. (E) Naïve CD4+ T cells were activated as described in (C) and transfected with indicated siRNA and plasmid. Lysosomal cathepsin gene expressions were quantified by RT-PCR. Results are normalized to control samples; mean ± SEM of four to six experiments; comparison by two-way analysis of variance (ANOVA) followed by Tukey’s multiple comparisons test. (F) TFEB and cathepsin transcripts from day 5–activated naïve CD4+ T cells from thirteen 20- to 35-year-old and thirteen 65- to 85-year-old healthy adults. Results are expressed relative to the mean of cells from young individuals. Horizontal lines represent mean values; comparison by two-tailed unpaired t test. (G) Transcriptome data from naïve CD4+ T cells from three young and three old healthy individuals stimulated with anti-CD3 and anti-CD28 beads for 5 days (accession number: SRA: SRP158502) (19). Violin plots and boxplots showing the fold gene expression differences of lysosomal genes, comparing the transcriptome of old to young T cells. Lysosomal gene sets were drawn from published experiments in human-derived cell lines (14, 18). Statistical analysis by Wilcoxon rank sum tests. (H and I) Naïve CD4+ T cells from a young healthy individual were stimulated and treated with FOXO1 inhibitor as in (C). Cells were then treated with DQ-BSA (5 μg/ml) for 5 hours. Fluorescence of cleaved DQ-BSA was analyzed by flow cytometry. (H) Representative histograms (left) and results of paired samples from seven young healthy individuals (right); two-tailed paired t test. (I) Representative histograms (left) and cumulative data from 12 young and 12 old healthy individuals; two-tailed unpaired t test. The gray histogram represents untreated naïve CD4+ T cells. *P < 0.05, **P < 0.01, ***P < 0.001, ****P < 0.0001. MFI: mean fluorescence intensity.
