
Fig. 2. Failure in FOXO1 reexpression promotes MVB expansion and exosome secretion in old naïve CD4+ T cells.
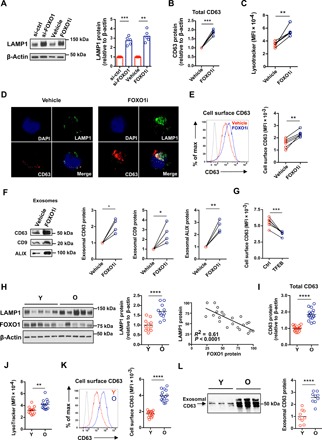
(A to E) Naïve CD4+ T cells were activated, silenced for FOXO1 expression, or treated with FOXO inhibitor as described in Fig. 1C. (A) LAMP1 protein expression was determined by Western blotting. Representative Western blots (left) and results relative to those of cells from control-silenced or vehicle-treated samples (right) (n = 5, mean, two-tailed paired t test). (B) Western blot results for CD63, expressed relative to vehicle-treated cells (n = 5, two-tailed paired t test). (C) Flow cytometry of LysoTracker staining. MFI from five experiments (two-tailed paired t test). (D) Cells were stained with anti-LAMP1 (green) and anti-CD63 (red). Confocal images representative of three independent experiments show accumulation of LAMP1 and CD63 in FOXO1-inhibited naïve CD4+ T cells. DAPI, 4′,6-diamidino-2-phenylindole. (E) Flow cytometry of cell surface CD63 expression. Representative histograms (left) and results from five experiments (right; two-tailed paired t test). The shaded histogram represents isotype control. (F) Naïve CD4+ T cells were cultured for the past 24 hours of the 5-day culture in exosome-depleted medium. Exosomes were isolated and assessed for exosomal markers (CD63, CD9, and ALIX) by immunoblotting. Representative Western blots and results from four experiments (expressed relative to vehicle-treated cells, two-tailed paired t test). (G) TFEB expression was restored in old naïve CD4+ T cells by transfection with a TFEB construct (fig. S5). CD63 cell surface expression in control- and TFEB-transfected activated CD4+ T cells was compared (n = 6, two-tailed paired t test). (H to L) Naïve CD4+ T cells from 20- to 35- and 65- to 85-year-old healthy individuals were stimulated with anti-CD3/anti-CD28 beads for 5 days. (H) LAMP1 and FOXO1 protein expression were determined by Western blotting. Representative Western blots and cumulative data from 11 young and 11 old healthy individuals (two-tailed unpaired t test, left); Pearson correlation plot of FOXO1 and LAMP1 (right). (I) CD63 Western blots from experiments of 16 young and 16 old individuals (two-tailed unpaired t test). (J) Acidic organelles were quantified as in (D). Cumulative data from 13 young and 13 old healthy individuals (two-tailed unpaired t test). (K) Flow cytometry of cell surface CD63. Representative histograms (left) and cumulative data from 15 young and 15 old healthy individuals (right; two-tailed unpaired t test). The shaded histogram represents isotype control. (L) Western blots for CD63 in exosomes isolated as described in (F). Representative Western blots (left) and results from nine young and nine old individuals (right; two-tailed unpaired t test). *P < 0.05, **P < 0.01, ***P < 0.001, ****P < 0.0001.