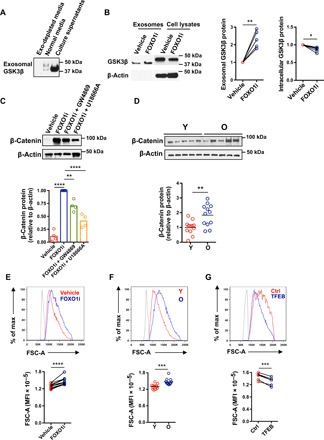
Fig. 3. Sequestration of GSK3β by expanded MVBs induces increased cell size in old activated naïve CD4+ T cells.

(A) Naïve CD4+ T cells were activated; exosomes were isolated on day 5 as described in Fig. 2F and probed for GSK3β. Western blots are representative of four experiments. (B) Exosomal and cytoplasmic GSK3β from naïve CD4+ T cells cultured in the presence of vehicle or FOXO1 inhibitor for the past 24 hours of 5-day culture after activation. Representative Western blots and results from five experiments (expressed relative to vehicle-treated cells, two-tailed paired t test). (C) Naïve CD4+ T cells from young healthy individuals were activated with anti-CD3/anti-CD28 beads for 5 days, the past 2 days in the presence of vehicle or indicated inhibitors. β-Catenin expression was determined by Western blotting. Representative Western blots (top) and results from four experiments (expressed relative to FOXO1 inhibitor–treated cells, bottom; one-way ANOVA followed by Tukey’s multiple comparisons test). (D) β-Catenin expression in CD4+ naïve T cells from twelve 20- to 35-year-old and twelve 65- to 85-year-old healthy individuals on day 5 after stimulation. Representative Western blots (top) and cumulative results (expressed relative to young individuals, bottom; two-tailed unpaired t test). (E) FSC-A of activated naïve CD4+ T cells cultured in the presence or absence of a FOXO1 inhibitor for the past 48 hours was determined by flow cytometry. Representative histograms (top) and results of paired samples from 10 young healthy individuals (bottom; two-tailed paired t test). The shaded histogram represents unstimulated naïve CD4+ T cells. (F) Representative FSC-A histograms (top) and data from day 5–activated naïve CD4+ T cells from 15 young and 15 old healthy individuals (bottom; two-tailed unpaired t test). The shaded histogram represents unstimulated naïve CD4+ T cells. The horizontal lines represent mean values. (G) TFEB expression was restored in activated naïve CD4+ T cells from old individuals by transfection with a TFEB construct (fig. S5). FSC-A in control and TFEB-transfected activated CD4+ T cells were compared (n = 6, two-tailed paired t test). *P < 0.05, **P < 0.01, ***P < 0.001, ****P < 0.0001.
