
Fig. 4. MVB sequestration of GSK3β regulates glucose homeostasis in old naïve CD4+ T cells.
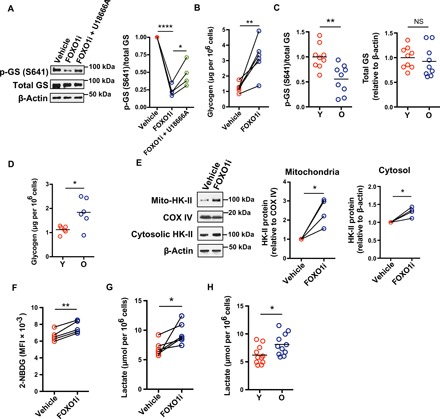
(A) Naïve CD4+ T cells from a young healthy individual were activated with anti-CD3/anti-CD28 beads for 3 days and then treated with vehicle or inhibitors for 2 days. Phosphorylated glycogen synthase (p-GS) and total glycogen synthase (GS) were determined by Western blotting. Representative Western blots (left) and results from four experiments shown as the ratios of p-GS and total GS relative to vehicle-treated cells (right; one-way ANOVA followed by Tukey’s multiple comparisons test). (B) Intracellular glycogen was quantified in naïve CD4+ T cells from six young individuals activated by anti-CD3/anti-CD28 beads and treated with vehicle control or FOXO inhibitors for the past 24 hours of culture; comparison by two-tailed paired t test. (C) p-GS and total GS in CD4+ naïve T cells on day 5 after stimulation were determined by Western blotting. Results of the ratios of p-GS (left) and total GS (right) from nine young and nine old healthy individuals (two-tailed unpaired t test). (D) Intracellular glycogen levels of CD4+ naïve T cells from six young and six old healthy individuals on day 5 after stimulation (two-tailed unpaired t test). (E) Naïve CD4+ T cells were activated and treated with FOXO1 inhibitor (AS1842856) as in (A). Mitochondria and cell cytosol were isolated. Mito-HK-II and cytosolic HK-II were assessed by Western blotting. Representative Western blots of cells from one healthy individual (left) and results from four experiments for mito-HK-II (middle) and for cytosolic HK-II (right), expressed relative to vehicle-treated cells (two-tailed paired t test). (F and G) Naïve CD4+ T cells were activated and treated with FOXO1 inhibitor (AS1842856) as in (B). Glucose uptake was determined by flow cytometry of 2-NBDG uptake. Results from cells of five young healthy individuals; two-tailed paired t test (F). Lactate concentrations were measured in culture supernatants of cells from six young healthy individuals; two-tailed paired t test (G). (H) Lactate concentrations from supernatants of activated naïve CD4+ T cells from 11 young and 11 old individuals (two-tailed unpaired t test). The horizontal lines represent mean values. *P < 0.05, **P < 0.01, ***P < 0.001.