. 2020 Apr 8;9:e53683. doi: 10.7554/eLife.53683

Figure 2. Electrophysiological characterization of MtTMEM175.

(a) Current responses to standard voltage pulse protocol in mock (○) and MtTMEM175 (⚫) transfected HEK293 cells (upper panel) and corresponding steady state I/V relations (lower left). Plot of currents recorded in same manner at −100 mV for individual cells (small symbols) and mean ±s.d. (large symbols) (lower right). Number of cells in brackets. (b) HEK293 cells expressing MtTMEM175 before (⚫) and after (○) adding 5 mM ZnSO4 to the bath solution containing 150 mM K+ (upper panel). Mean I/V relation (bottom left) of n = 4 cells (±s.d.). To compare the effect on different cells the I/V relation was normalized to currents at −100 mV in the absence of blocker (bottom left). The voltage dependency of the Zn2+ block was estimated by dividing currents in the presence and absence of Zn2+ (I+Zn/I-Zn) (bottom right) (c) HEK293 cells expressing MtTMEM175 (top row) before (left) and after (middle) replacing Na+ (○) with K+ (⚫) in the external buffer and corresponding I/V relation (bottom left). Same experiments were performed by exchanging K+ in external buffer by other cations. The mean reversal voltage (Erev) (±s.d., number of cells in brackets) is depicted in lower right panel. (d) Exemplary channel fluctuations at ±100 mV measured in cell-attached configuration on HEK293 cells expressing MtTMEM175 (upper) and pooled unitary I/V relation of single channel events from 10 measurements in four different cells (lower right) using standard bath and pipette solutions.

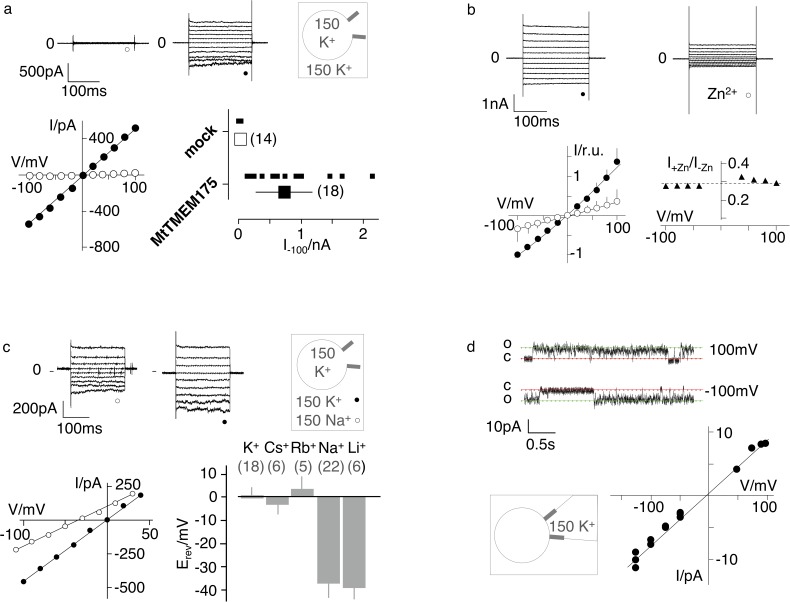
Figure 2—source data 1. Raw data for Figure 2a.
Figure 2—source data 2. Raw data for Figure 2b.
Figure 2—source data 3. Raw data for Figure 2c.
Figure 2—source data 4. Raw data for Figure 2d.

Figure 2.

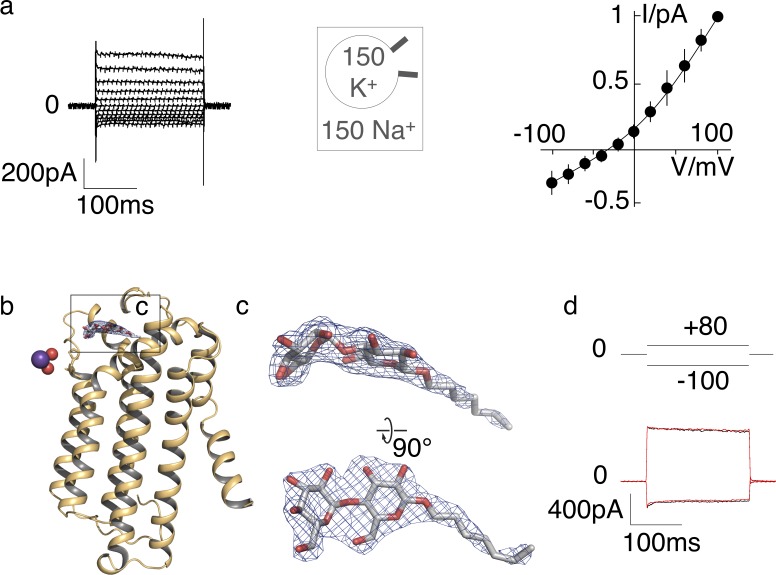
Figure 2—figure supplement 1. K+ selectivity in ScTMEM175 and electron density of a putative maltoside in the MtTMEM175 structure.

Figure 2—figure supplement 1.

(a) Current responses of ScTMEM175 transfected HEK293 cells to voltage steps between ±100 mV (left). Cells were measured with 150 mM Na+ and 150 mM K+ in the bath and pipette solution, respectively. Mean steady state I/V relation (±s.d.) from 4 cells measured under the same condition. Data were normalized to currents at +100 mV. The mean reversal voltage of the 4 cells is −37 ± 9 mV (right). (b) Residual density on the extracellular entrance of MtTMEM175 was attributed to a detergent molecule (DDM or DM). The 2Fo-Fc density (at 2.4 Å, contoured at 1.5 σ after sharpening with b=-40, blue) is displayed. Only one subunit is shown. (c) Close-up views on the maltoside with overlaid 2Fo-Fc density. (d) Current responses of HEK293 cells expressing MtTMEM175 to voltage steps from 0 mV to +80 /- 100 mV before (black) and after (red) adding 10 mM maltose to the bath solution with 150 mM Na+.
Figure 2—figure supplement 1—source data 1. Raw data for Figure 2—figure supplement 1.
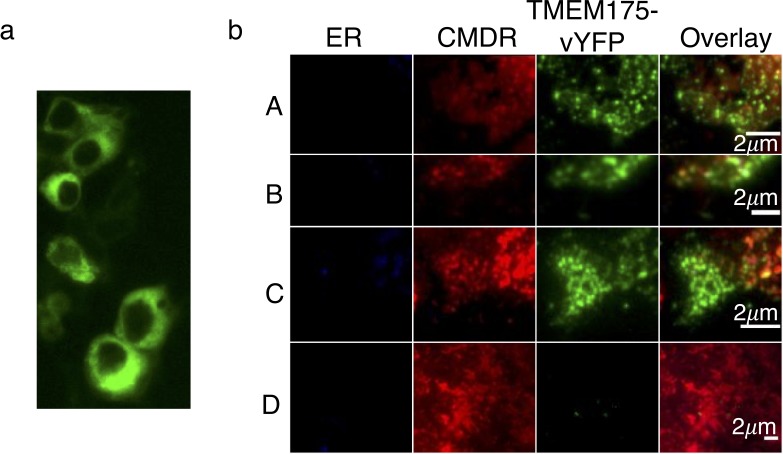
Figure 2—figure supplement 2. Plasma membrane localization of TMEM175 proteins.

Figure 2—figure supplement 2.

(a) Expression profile of C-terminally vYFP-tagged MtTMEM175 in HEK293 cells. (b) TIRF images of membrane patches from decapitated HEK293 cells. Patches were obtained from cells transiently expressing C-terminally vYFP-tagged hTMEM175 (A), MtTMEM175 (B) or MtTMEM175 T38A mutant (C). Untransfected cells served as a negative control (D). Columns from left to right: ER stained with ER tracker blue, plasma membrane (PM) stained red with CMDR, vYFP-tagged TMEM175 proteins. Last column shows merged images of different vYFP-tagged TMEM175 variants with ER and PM stain. Scale bar = 2 μm.
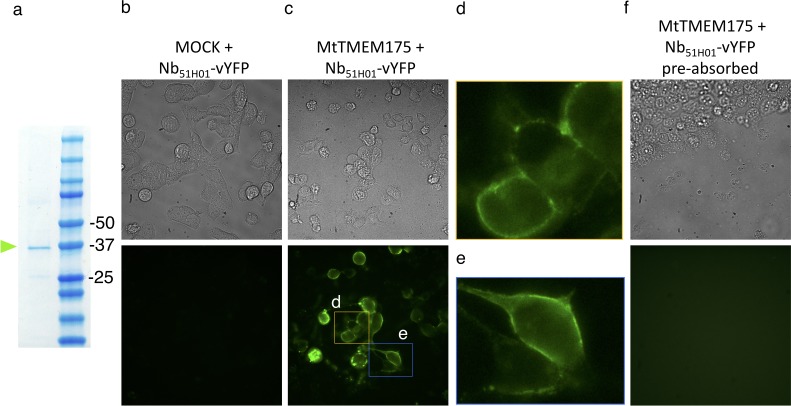
Figure 2—figure supplement 3. Cell surface labelling of MtTMEM175 using Nb51H01-vYFP.

Figure 2—figure supplement 3.

(a) SDS Page of purified vYFP-tagged Nb51H01 before application in (b,c,f). (b,c,f) Bright field (top row) and GFP-channel images (bottom row) after application of purified Nb51H01-vYFP to MOCK (b) or MtTMEM175 (c,f) transfected HEK cells. (d,e) Enlarged sections of epifluorescence images in (c). In (f) the Nb51H01-vYFP was pre-absorbed with an excess of purified non-fluorescent MtTMEM175 before application to the cells.
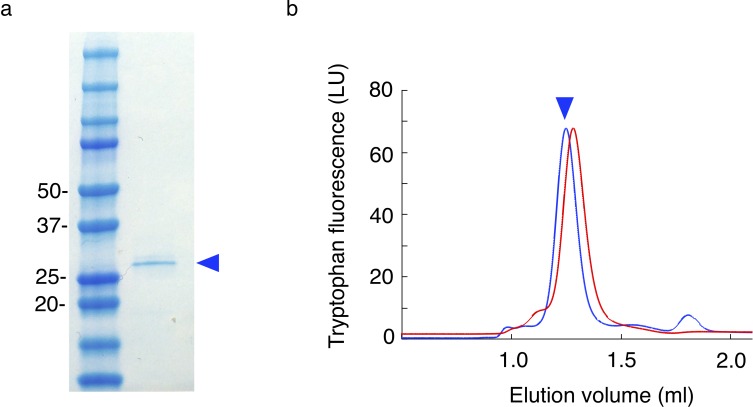
Figure 2—figure supplement 4. Purification of MtTMEM175 from HEK cells.

Figure 2—figure supplement 4.

(a) Coomassie stained SDS-PAGE of purified MtTMEM175 from HEK cells before subjecting to size exclusion chromatography in (b). (b) Size exclusion chromatography with MtTMEM175 purified from HEK cells (blue) in comparison with MtTMEM175 purified from E. coli (red). The difference in the retention volumes between the two samples arises from the presence (blue) or absence (red) of the purification tags. The peak heights are normalized.
Figure 2—figure supplement 4—source data 1. Raw data for Figure 2—figure supplement 4.