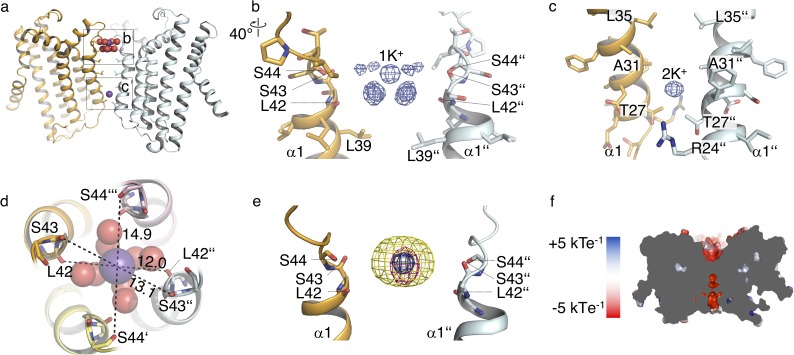
Figure 3. Ions in the MtTMEM175 structure.
(a–c) Side view on MtTMEM175 (a) and close-up views of the ion binding site with a hydrated K+ ion at position 1K+ (b) and another K+ ion within the pore at position 2K+(c). In (a), K+ ions and water molecules are displayed as purple and red spheres, respectively. In (b) and (c) the 2Fo-Fc electron density is depicted as blue mesh at the position 1K+ and 2K+ (at 2.4 Å, contoured at 1.8 σ, sharpened with b=-25). Two subunits are omitted for clarity. (d) Top view of the ion binding site. Distances between opposing backbone oxygens of Leu42, Ser43 and Ser44 are indicated in Å. Side chains are omitted and the size of the spheres is reduced for clarity. (e) Substitution of K+ in the ion binding site with Cs+ and Rb+. The 2Fo-Fc electron density (as in (b) and (c), blue mesh) marks the position of the K+ ion. Anomalous difference electron densities of Cs+ (at 3.8 Å, contoured at 7 σ) and Rb+ (at 3.6 Å, contoured at 7 σ, blurred with b = 125) are shown in yellow and magenta, respectively. (f) Illustration of the surface electrostatic potential across the pore.


