. 2020 Apr 8;9:e53683. doi: 10.7554/eLife.53683

Figure 6. Sensitivity of the hTMEM175 S45A mutant for Zn2+ and 4-AP.

(a) Currents elicited by a ramp protocol (−80 to +40 mV in 200 ms) in HEK293 cells expressing hTMEM175 WT (upper left) or hTMEM175 S45A mutant (lower left) in absence (black) and presence (red) of 5 mM ZnSO4 in external bath solution (150 mM K+). Columns (lower right) summarize average inhibition (± s.d.) of current amplitudes at −60 mV from 3 and 4 recordings in the hTMEM175 WT and S45A mutant, respectively. The ratio of currents in the presence and absence of Zn2+ (I+Zn/I-Zn) show the voltage independence of channel block (upper right). (b), same as in (a) with representative measurements in absence (black) or presence (red) of 100 µM 4-AP in external bath solution (150 mM K+) for hTMEM175 WT (upper left) and S45A mutant (lower left), respectively. Columns show average inhibition (± s.d.) of current amplitudes at −60 mV from four measurements in the hTMEM175 S45A mutant and WT, respectively.

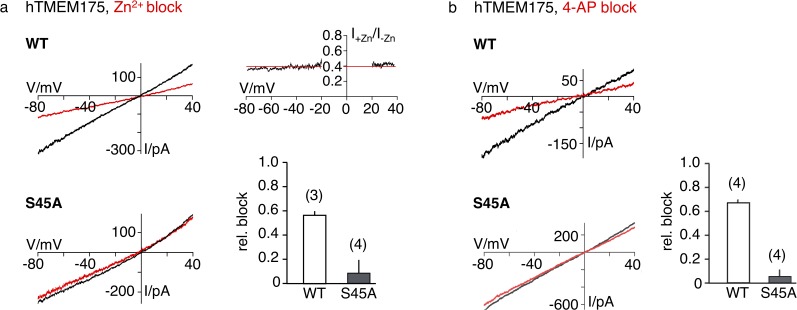
Figure 6—source data 1. Raw data for Figure 6a.
Figure 6—source data 2. Raw data for Figure 6b.

Figure 6.

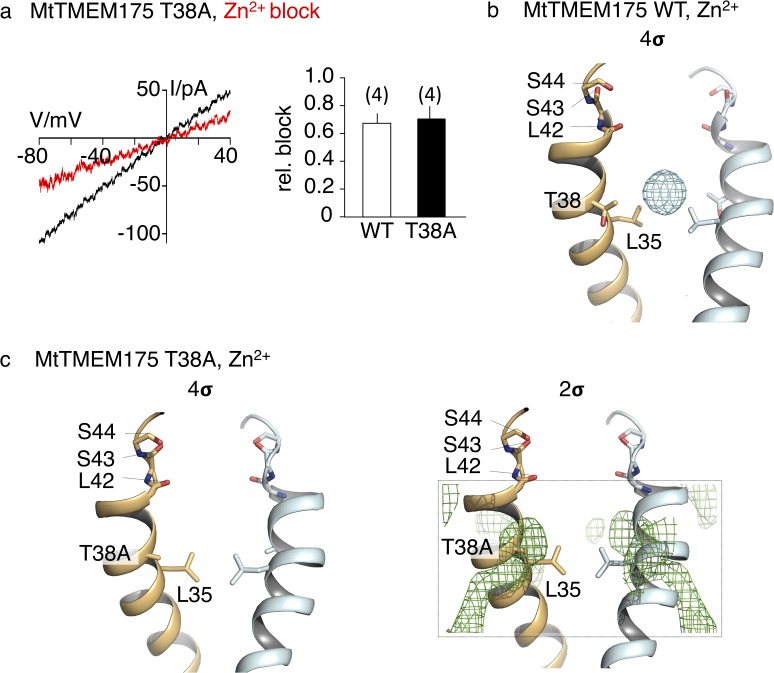
Figure 6—figure supplement 1. Sensitivity to Zn2+ and anomalous density of Zn in the pore of MtTMEM175.

Figure 6—figure supplement 1.

(a) Representative currents elicited by a ramp protocol (−80 to +40 mV in 200 ms) in HEK293 cells transfected with the MtTMEM175 T38A mutant in absence (black) and presence (red) of 5 mM ZnSO4 in external bath solution containing 150 mM K+. Column summarizes average inhibition (± s.d.) of current amplitudes at −60 mV from four recordings in the MtTMEM175 T38A mutant and WT, respectively. (b) Location of zinc ions within the pore of MtTMEM175. Anomalous difference electron density of Zn2+ is illustrated as cyan mesh (at 2.88 Å, contoured at 4 σ, blurred with b = 200). Front and rear subunits are omitted for clarity. (c) No zinc ions can be detected in the T38A mutant of MtTMEM175 (Fo-Fc density at 3.2 Å, contoured at 4 σ (left) or at 2 σ (right), respectively, blurred with b = 200).
Figure 6—figure supplement 1—source data 1. Raw data for Figure 6—figure supplement 1.
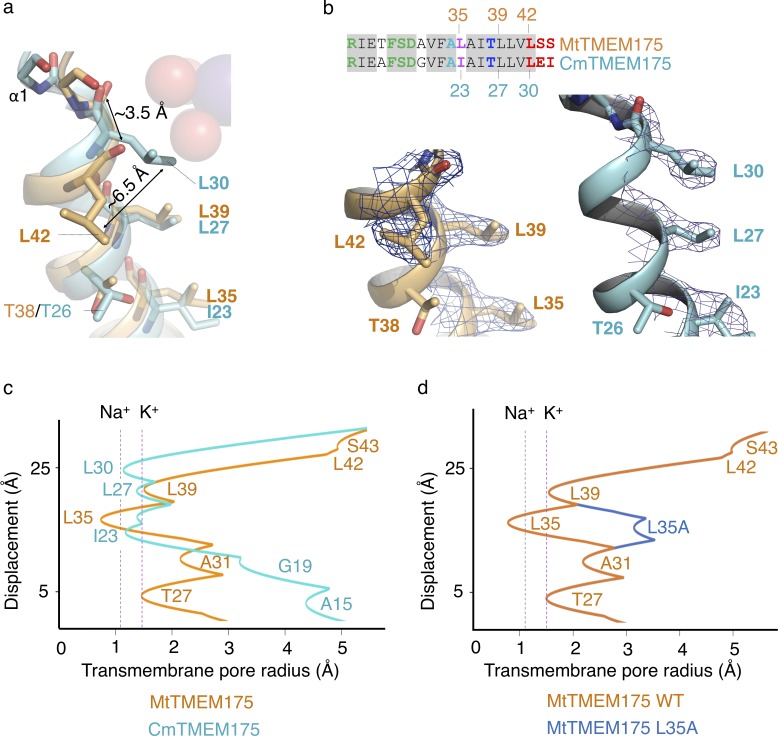
Figure 6—figure supplement 2. Constriction points in MtTMEM175 and CmTMEM175.

Figure 6—figure supplement 2.

(a) Overlay of helix one from MtTMEM175 (orange) and CmTMEM175 (5VRE, cyan) with close-up view on residues Leu35, Leu39 and Leu42 in MtTMEM175 and Ile23, Leu27 and Leu30 in CmTMEM175, respectively. Deviations between the side chains and backbone oxygens of Leu42 in MtTMEM175 and Leu30 in CmTMEM175 are shown in Å. The view is from the side. (b) The corresponding 2Fo-Fc densities are shown for MtTMEM175 (left, at 2.4 Å, contoured at 1.8 σ after sharpening with b=-25) and CmTMEM175 (right, at 3.3 Å, contoured at 1.55 σ). A sequence alignment of helix one in MtTMEM175 and CmTMEM175 with the respective residues numbered is displayed. (c) Comparison of a HOLE analysis of the pore in MtTMEM175 and CmTMEM175. The pore radius along the central axis is shown in Å. Dashed lines indicate the radii for K+ and Na+ without inner hydration shell. The structures used in the HOLE analysis were aligned to superimpose Leu35 and Thr38 in MtTMEM175 with Ile23 and Thr26 in CmTMEM175. (d) HOLE calculation of MtTMEM175 WT and the mutant L35A. Leu35 corresponds to Ile23 in CmTMEM175. The pore radius along the central axis is shown in Å. Dashed lines indicate the radii for K+ and Na+ without inner hydration shell.