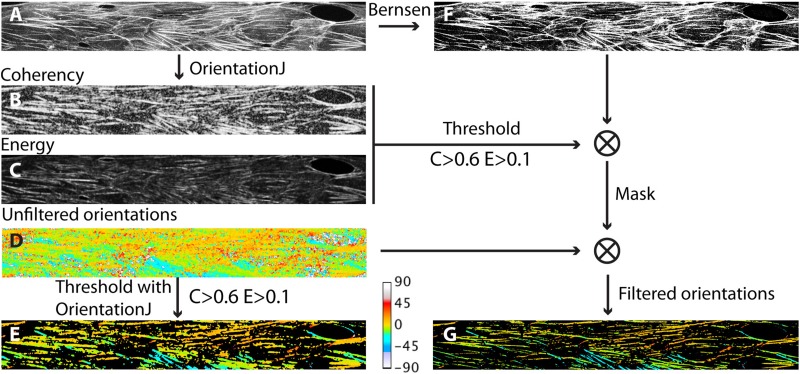
FIG. 2.
Flowchart of image analysis: starting from a F-actin image (a), the OrientationJ plugin outputs Coherency (b), Energy (c), and Orientation (d) maps. OrientationJ allows filtering the orientation map in order to retain only pixels involved in regions having coherency and energy values larger than a given threshold ( and here) (e). As an alternative to the latter step, we apply a local thresholding scheme (Bernsen) to the initial image (f) and multiply this segmented image by the thresholded maps (b) and (c) in order to create a binary mask. We then use such a mask in order to discard irrelevant pixels from the raw orientation map (d), and obtain the orientation map (g), with better spatial resolution than (e). Colors on images (d), (e), and (g) code for the local angle, according to the lookup table displayed at the bottom of the figure.

