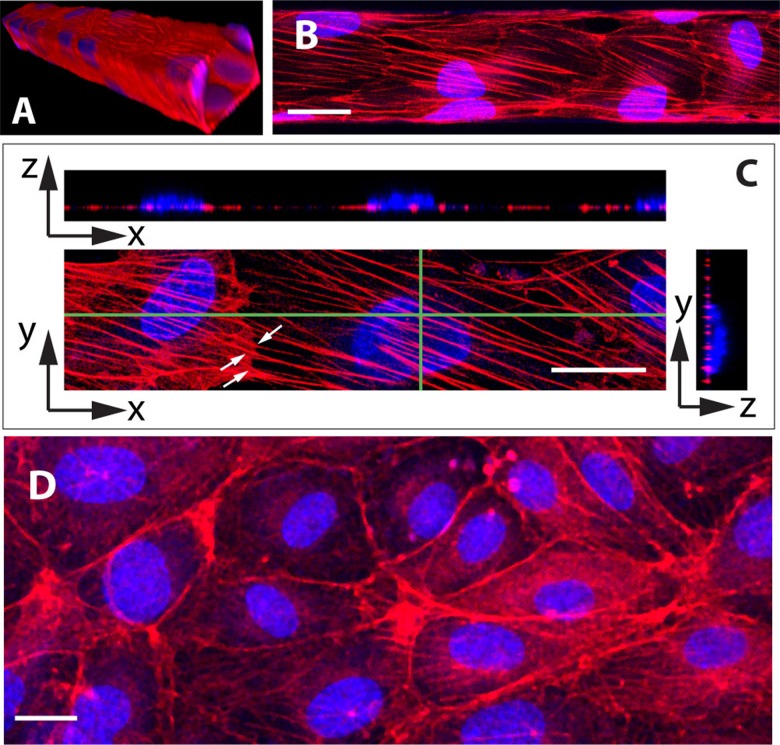
FIG. 3.
(a) 3D rendering of images from a portion of channel covered by HUVECs, having a cross section of and a length of [overlay of F-actin (red) and nuclei (blue)]. (b) Image of the bottom surface of a microchannel ( in cross section), showing the thick and oriented actin fibers displayed by HUVECs cultured under 0.4 Pa (flow direction from left to right. Scale bar ). (c) Image of adjacent cells (xy panel) showing actin fibers “crossing” the cells’ boundary (white arrows). Stress fibers are located at the basal side of the cells, as seen on the two orthogonal images showing fiber cross sections running below the nuclei (xz and yz panels taken along the directions indicated by green lines on the xy view. Scale bar ) (d) Image of HUVECs cultured under static conditions, showing F-actin being mainly localized at the periphery of the cells, with only few and randomly oriented fibers (scale bar ).

