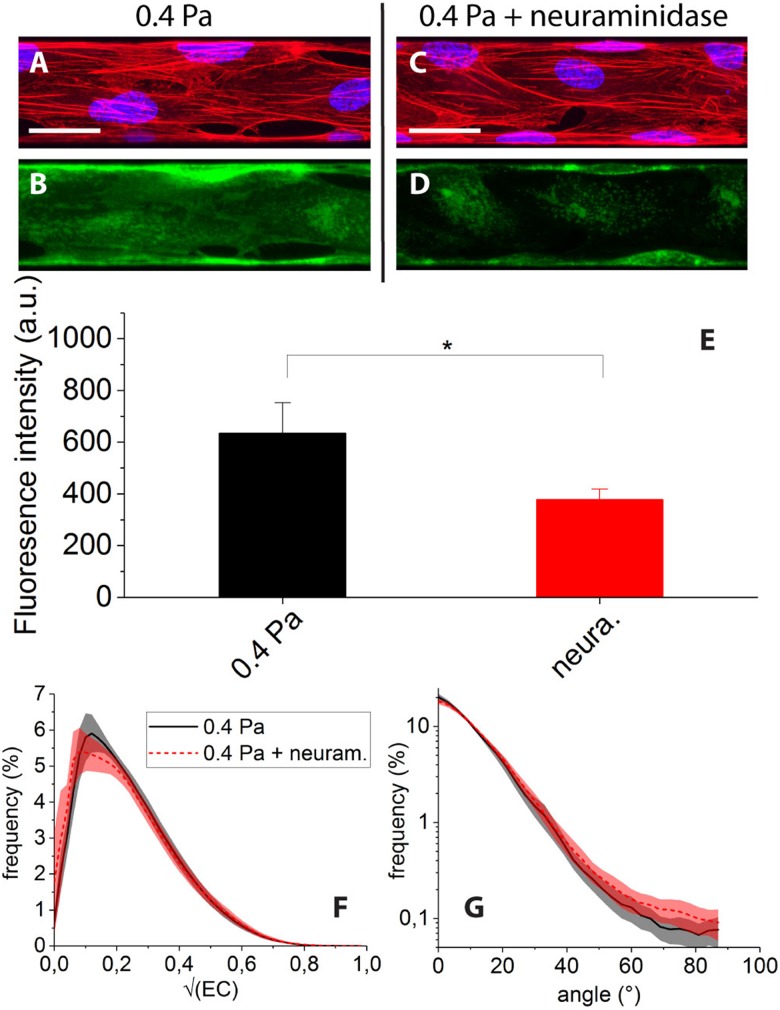
FIG. 7.
Overlay of nuclei and F-actin images of cells submitted to 0.4 Pa of shear stress, before (a) and after (c) neuraminidase treatment (scale bar ). Corresponding WGA-Alexa fluorescence images taken before (b) and after (d) treatment show a marked decrease in intensity upon treatment, as confirmed by fluorescence intensity histograms (e). Distributions of (f) and fiber angles (g) do not significantly differ between control condition (black continuous line) and degraded condition (red dashed line).

