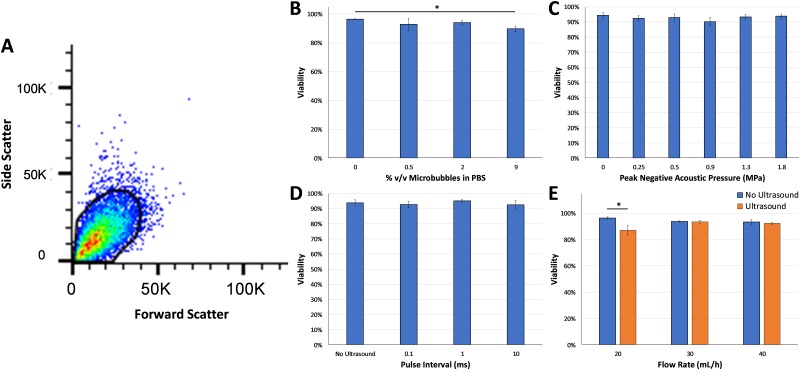
FIG. 3.
(a) Representative flow cytometry scatterplot with the gate used to detect viable erythrocytes based on forward and side scatter profiles. High viability of erythrocytes was observed at (b) different microbubble concentrations, (c) different acoustic pressures, (d) different pulse intervals, and (e) different microfluidic flow rates. Statistically significant decreases in viability were detected at a microbubble dose of 9% (ANOVA p < 0.05) and with ultrasound treatment at a microfluidic flow rate of 20 ml/h (p < 0.05) compared to the no ultrasound control groups.

