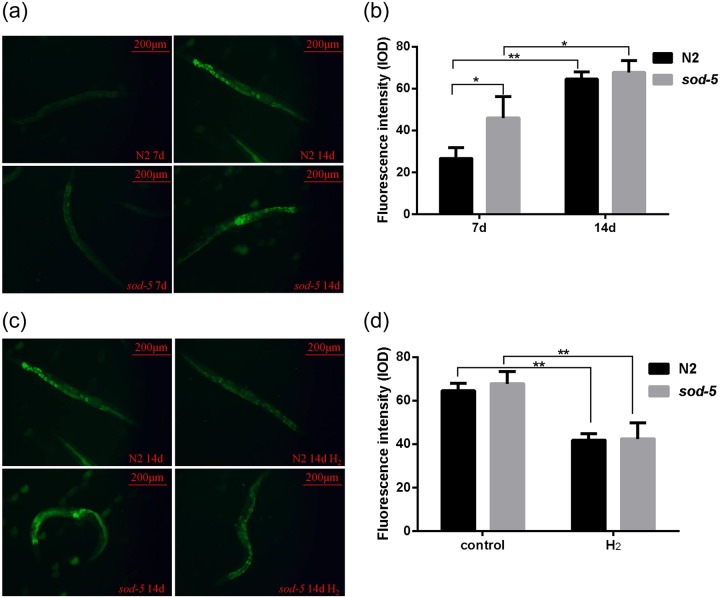
Fig 2. Effects of hydrogen on ROS levels in C. elegans.
(A) and (C): Corresponding fluorescent images captured by the Image Xpress Micro System. (B): ROS levels of N2 and sod-5 nematodes (days 7 and 14). (C): Effects of hydrogen on ROS levels of N2 and sod-5 nematodes (day 14). Fluorescence intensity was analyzed using Image-Pro Plus 6.0, and the data are shown as the mean ± SD of three independent experiments. *p<0.05; ** p<0.01.

