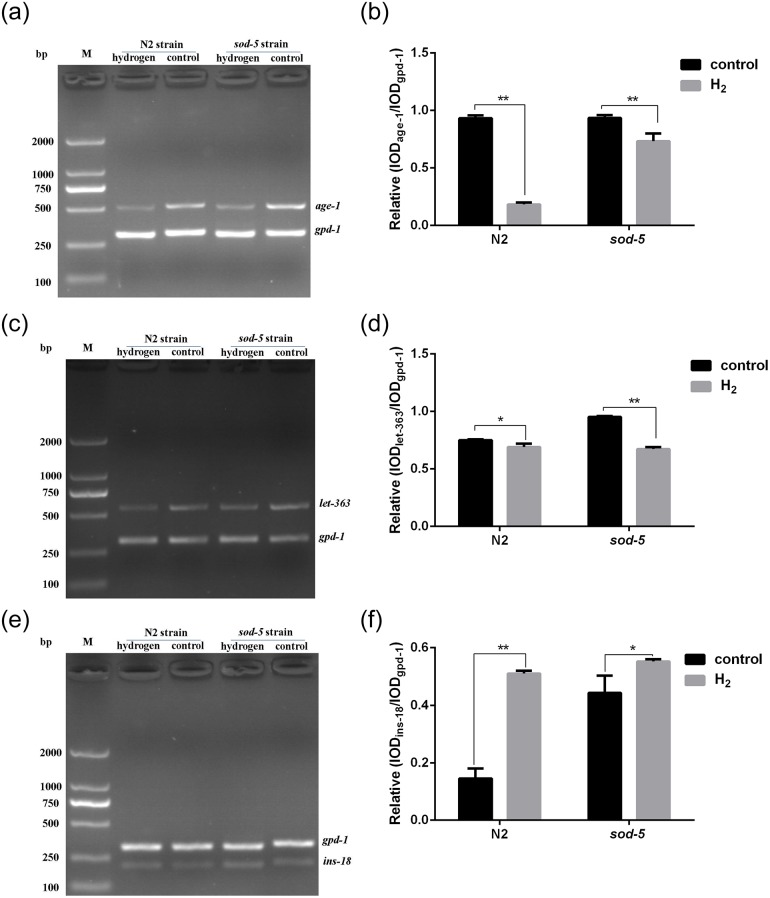
Fig 3. Expression of several genes in C. elegans after hydrogen treatment.
(A), (C) and (E): A gel image of the PCR product was collected by a gel imager. (B), (D), and (F): The integrated optical density (IOD) values of each gene fragment were analyzed by Image-Pro Plus 6.0. The ratio of IOD of the target gene to the internal reference gene gpd-1 was used as a measure of the level of expression of the target gene. Data are shown as the mean ± SD of three independent experiments. * p<0.05; ** p<0.01.

