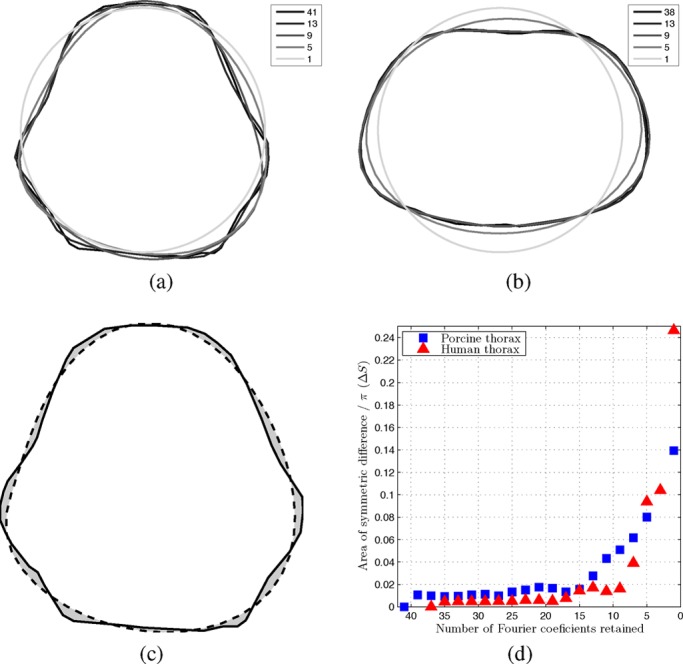
Fig. 2.

Representative swine (a) and human (b) thorax model shapes. Legends indicate the number of retained Fourier coefficients. (c) Area of symmetric difference between the original pig thorax shape and a smooth one. (d) Area of symmetric difference for both human and porcine model shapes as a function of the number of Fourier coefficients retained.
