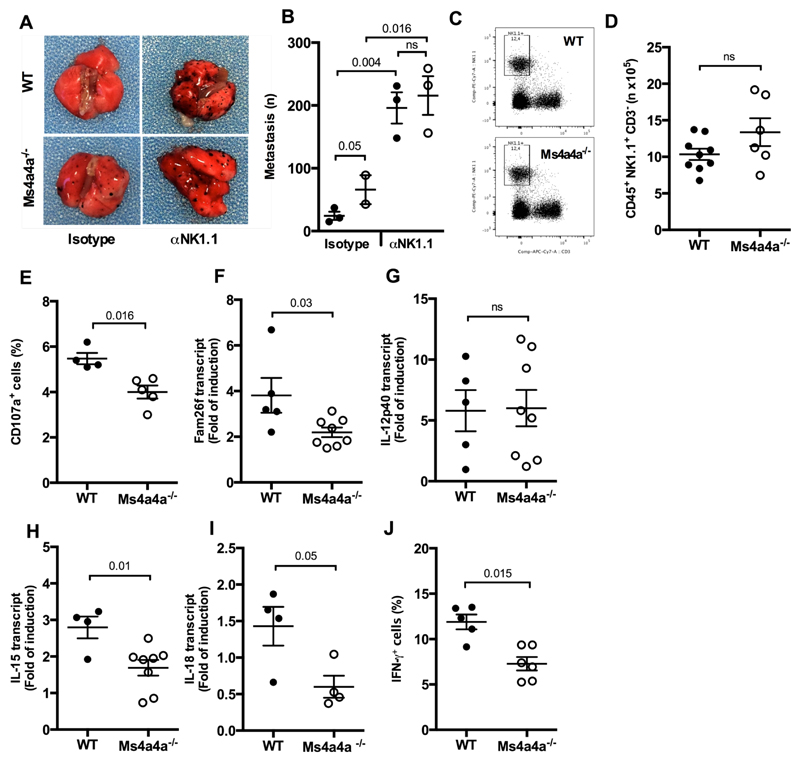
Figure 7. Expression of Ms4a4a in macrophages is required for NK-mediated Dectin-1-triggered protection against metastasis.
A-B) Representative images (A) and number of metastatic foci (B) in lungs from Ms4a4a-/- (open symbol) and WT (closed symbol) mice injected i.v. with B16F1 cells upon NK cell depletion. Results are expressed as mean ± SEM. Two experiments performed (n = 2 - 3 for each group). Statistical analysis by one-way ANOVA and unpaired Student’s t test.
C-D) Representative dot plots (C) and numbers (D) of NK cell infiltrating the lungs of Ms4a4a-/- (open symbol) and WT (closed symbol) mice injected i.v. with B16F1 cells. Data are represented as mean ± SEM of absolute numbers (n) of Live/CD45+/CD3-/NK1.1+ cells. Three experiments were performed (n = 9 for WT and 6 for Ms4a4a-/-). Statistical analysis by two-tailed unpaired Student’s t test. Gating strategy in Figure S10M.
E) Degranulation of NK cells after engagement with B16F1 cells. Data are represented as mean ± SEM of percentage of CD107a+ NK cells gated on Live/CD45+/CD3-/NK1.1+ splenocytes. Two experiments were performed (n = 4 for WT and 5 for Ms4a4a-/-). Statistical analysis by two tailed unpaired (Mann-Whitney) Student’s t test. Gating strategy in Figure S10L.
F-I) Transcript abundance of INAM (Fam26f; F), IL-12p40 (G), IL-15 (H), and IL-18 (I) in Ms4a4a-/- (open symbol) and WT (closed symbol) BMDM primed with 10 ng/ml rmGM-CSF cocultured for 24 h with B16F1 apoptotic cells (heat-shocked by 5 min at 65°C and 5 min on ice). Data are expressed as mean ± SEM of fold of induction. Two experiments were performed for panel F (n = 5 for WT and 8 for Ms4a4a-/-), G (n = 5 for WT and 8 for Ms4a4a-/-), H (n = 4 for WT and 8 for Ms4a4a-/-), and I (n = 4 for WT and 4 for Ms4a4a-/-). Statistical analysis by two-tailed unpaired Student’s t test.
J) IFNγ production by NK cells after engagement with B16F1 cells. Data are represented as mean ± SEM of percentage of IFNγ+ NK cells gated on Live/CD45+/CD3-/NK1.1+ splenocytes. Two experiments were performed (n = 5 for WT and 6 for Ms4a4a-/-). Statistical analysis by two tailed unpaired (Mann-Whitney) Student’s t test. Gating strategy in Figure S10L.

