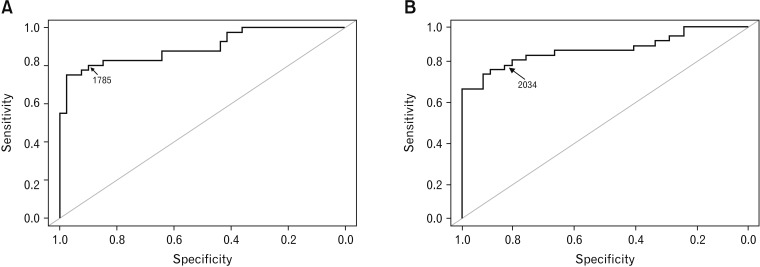
Figure 3.
Receiver operating characteristics curves for simple mean nocturnal baseline impedance at 3 cm (A) and 5 cm (B) above the lower esophageal sphincter for diagnosis of gastroesophageal reflux disease. The area under curves were 0.895 (95% CI, 0.824-0.966) and 0.881 (95% CI, 0.802-0.960) respectively, P = 0.508.

