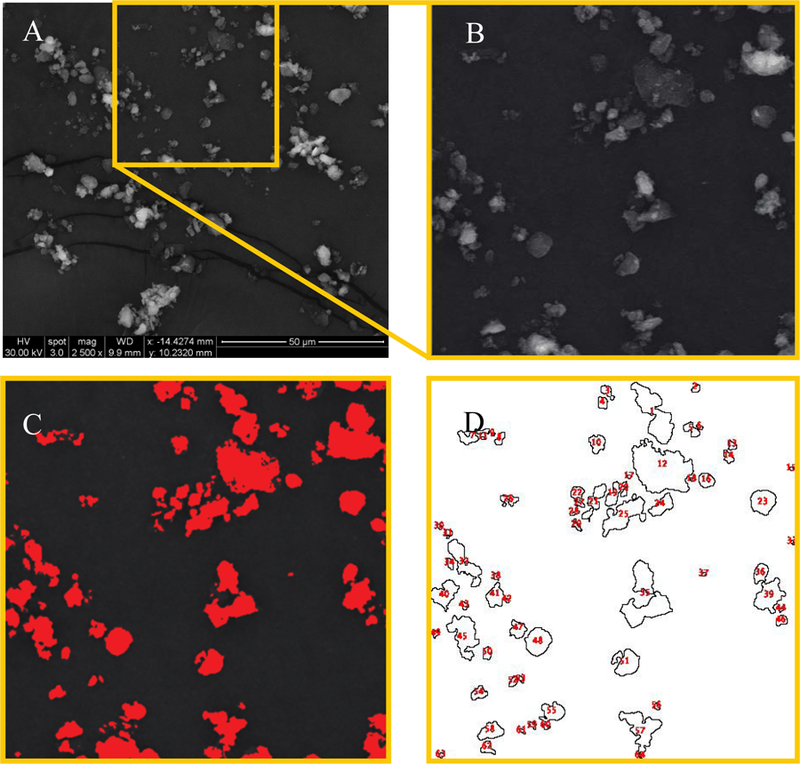
Figure 3.

Process of determining particle size distribution by ImageJ. (A) Environmental Scanning Electron Microscopy image of S1 playground dust sample viewed at 2,500× magnification. Yellow box indicates analyzed area. (B) Contrast and brightness adjustment for selected area. (C) Particle area analyzed. (D) Outlines of analyzed particles.
