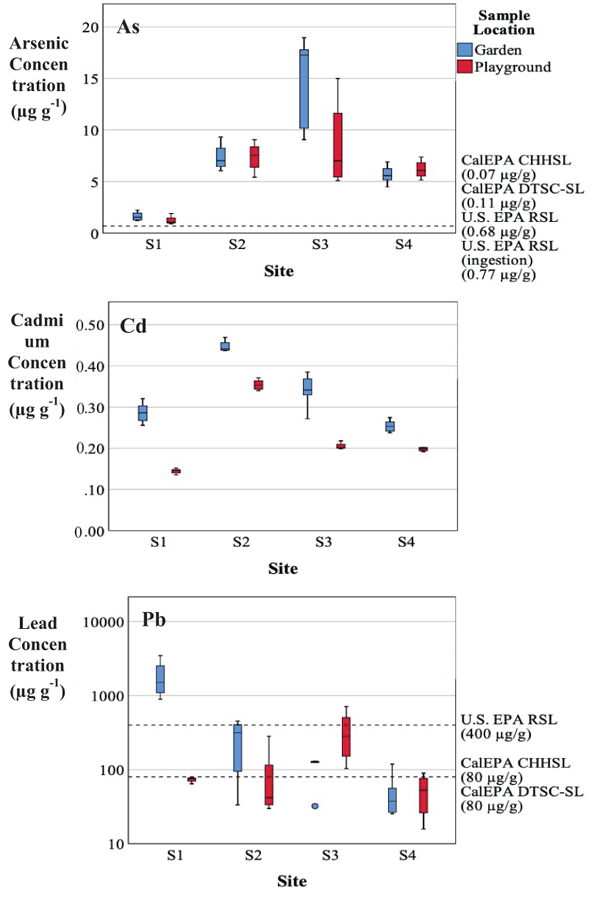
Figure 5.

Metal(loid) concentrations (µg g−1) measured from garden and playground soil samples (< 63 μm). Note: The box represents the 25% to 75% range, the line in the box is the median, the whiskers are the 5% and 95%, and outliners are represented with circles.
