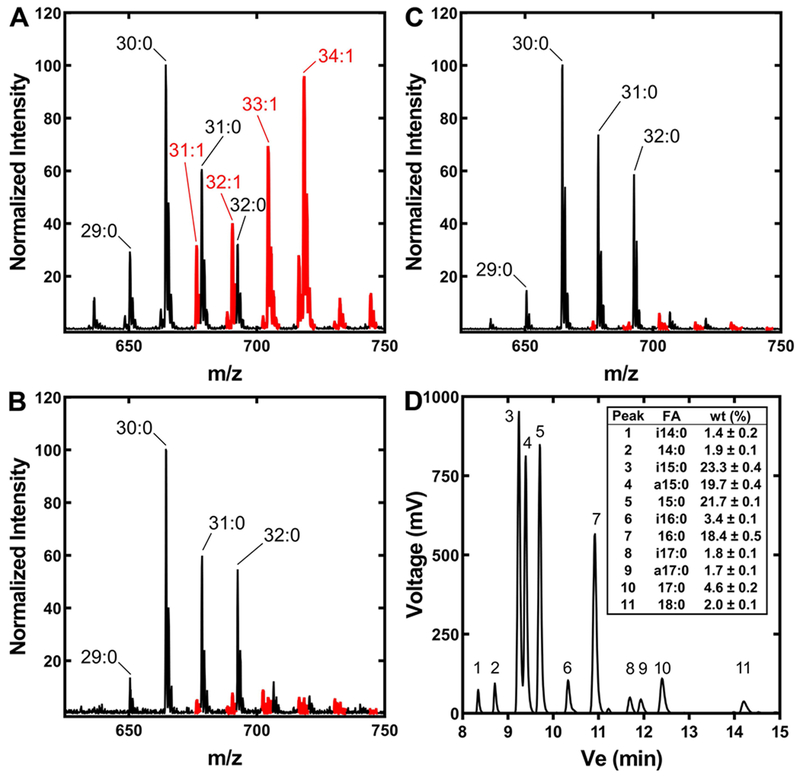
Figure 2. A. finegoldii PE and fatty acid composition.
A. finegoldii was grown in three different media, the lipids extracted and the PE molecular species profiled by mass spectrometry. PE molecular species containing an unsaturated fatty acid are indicated in red.
A. A representative mass spectrum of PE molecular species from A. finegoldii grown in DSM Medium 104.
B. A representative mass spectrum of PE molecular species from A. finegoldii grown in DSM Medium 104 without Tween 80.
C. A representative mass spectrum of PE molecular species from A. finegoldii grown in a defined minimal medium (Wilkins-Chalgren Anaerobe Broth, WCAB).
D. Fatty acid composition of A. finegoldii grown in WCAB medium. Methyl esters were prepared from lipid extracts and a representative gas chromatogram is shown. Inset, average fatty acid composition from three biological replicates. Only fatty acids >1% of the total were quantified. Mean ± S.E.M. i, iso; a, anteiso.

