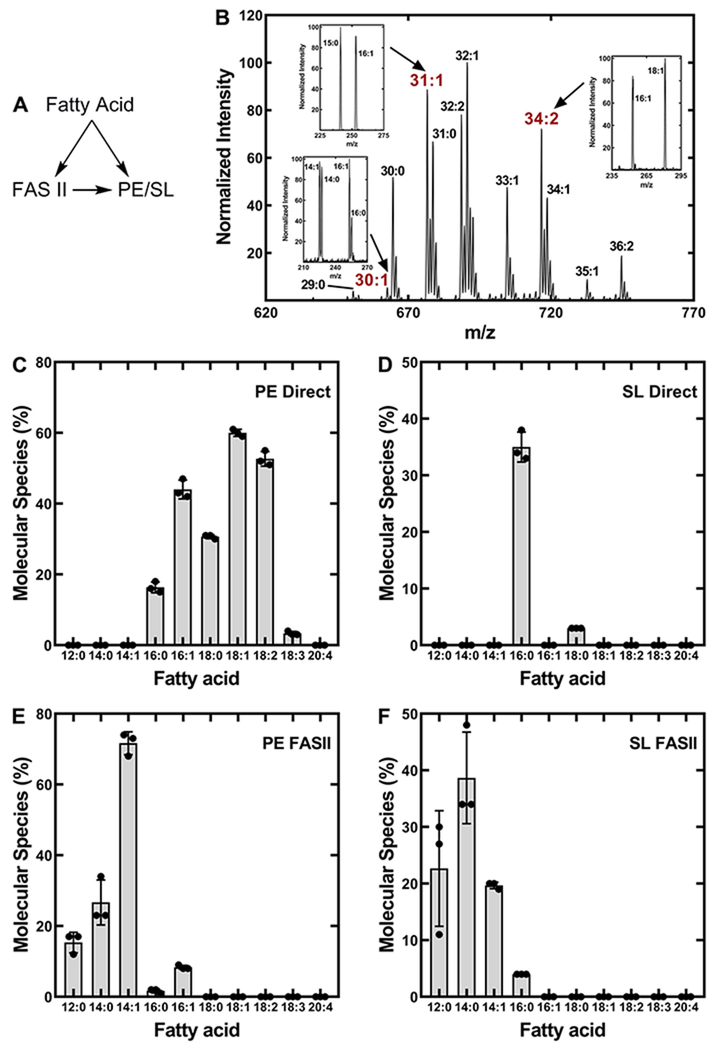
Figure 5. Metabolism of exogenous fatty acids by A. finegoldii.
A, A. finegoldii was grown in the presence of a series of heavy-labeled saturated or unsaturated fatty acids. The incorporation of each of these fatty acids into PE and SL was determined by mass spectrometry. There are two possible fates for the fatty acids after their entry into the cell. The exogenous fatty acid may be directly incorporated into PE or SL, or it may enter the FASII elongation cycle and its elongation product is incorporated into PE or SL.
B. An example of how the proportion of an exogenous fatty acid directly incorporated into PE or elongated by FASII prior to incorporation was determined by mass spectrometry. A. finegoldii was grown in the presence of 14:1 and the PE mass spectrum was obtained. Peaks with an unsaturated fatty acid were fragmented to determine their fatty acid composition. Insets, the 30:1 peak contained 16:1/14:0 and 16:0/14:1, the 31:1 peak was composed of 16:1/15:0, and the 34:1 peak was composed of 18:1/16:0. The percent contribution of each molecular species to the total was determined by integrating the ion current in each peak.
C. The percent of molecular species formed from the direct incorporation of fatty acids into PE without elongation.
D. The percent of molecular species with fatty acids that were directly incorporated into SL without elongation.
E. The percent of molecular species that contained a fatty acid that was elongated prior to incorporation into PE.
F. The percent of molecular species containing a fatty acid that was elongated prior to incorporation into SL. There were three biological replicates and the mean ± S.E.M. is plotted.

