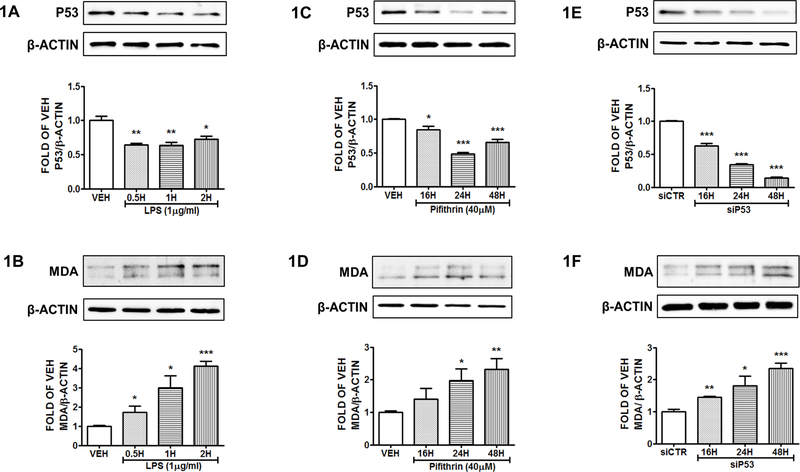
Figure 1: P53 suppression induces MDA expression in HuLEC-5a.
Western Blot analysis of P53 and β actin (A), MDA and β actin (B) after treatment of HuLEC-5a with vehicle (PBS) or LPS (1μg/ml) for 0.5, 1 and 2 hours. Western Blot analysis of P53 and β actin (C), MDA and β actin (D) after treatment of HuLEC-5a with vehicle (DMSO) or Pifithrin (PTH) (40 μg/ml) for 16, 24 and 48 hours. Western Blot analysis of P53 and β actin (E), MDA and β actin (F) after treatment of HuLEC-5a with irrelevant siRNA (siCTR) or siRNA for P53 (siP53) (0.3 μM) for 16, 24 and 48 hours. The blots shown are representative of 3 independent experiments. The signal intensity of the P53 and MDA bands were analyzed by densitometry. Protein levels were normalized to β actin. *P<0.05, **P<0.01, ***P<0.001 vs vehicle. Means ± SEM.

