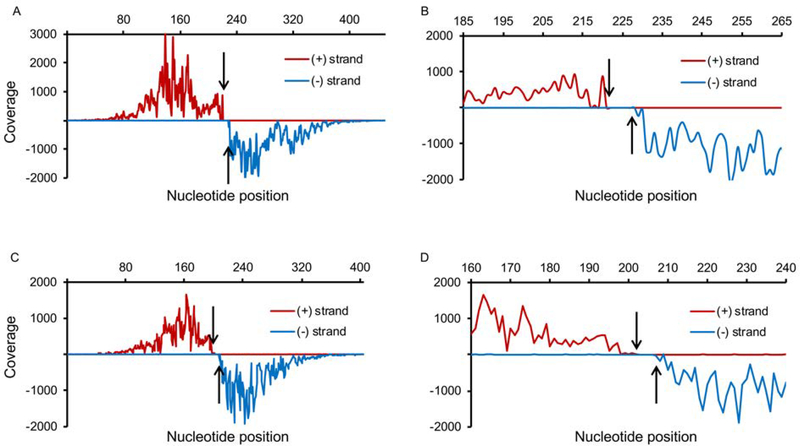
Fig. 2.
Coverage maps of CodY-binding regions using strand-specific counting of 5’ nucleotides of sequencing reads. The 453-bp mfd (A, B) and 405-bp lmaA (C, D) CodY-binding regions were identified after two rounds of purification using 1.6 or 8 nM CodY, respectively. The coverage of the (+) and (−) strands is shown above and below the x-axis, respectively. Arrows indicate a gap in coverage. Non-uniform coverage is likely due to varying position-specific efficiency of DNA shearing during sonication and to non-uniform size of DNA fragments. (A, C) Coverage of the entire binding region. (B, D) Coverage of the 80 bp surrounding the core CodY-binding site.

