
Figure 2.
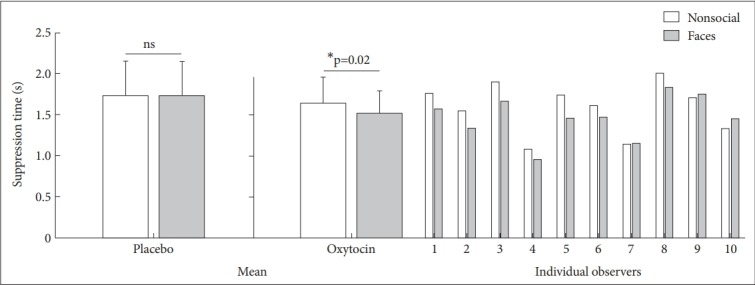
Suppression times for faces and nonsocial stimuli in the placebo and oxytocin group. The two bars on the left show the suppression times in the placebo condition, in which the test images are presented binocularly on the noise background. The right side of the figure shows the suppression times for 10 individual observers in the oxytocin group, as well as the averaged suppression times. Error bars represent standard error of the mean. Asterisks indicate a significant difference between faces and nonsocial stimuli. *p<0.05.