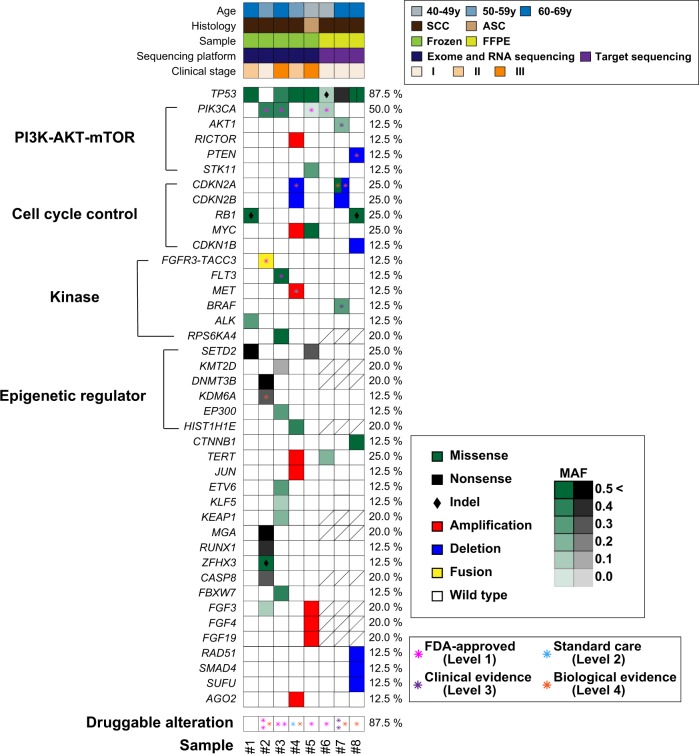
Fig. 1. Summary of pathogenetic alterations in MCT-SCCs.
Heatmaps demonstrate both sample information (upper) and distribution of genetic alterations (lower). In the lower heatmap, color and density indicate the type and MAF of each somatic mutation, respectively. Black diamonds represent indels. Asterisks indicate druggable alterations annotated in OncoKB on August 6, 2019. An oblique line in a square indicates that data are not available.

