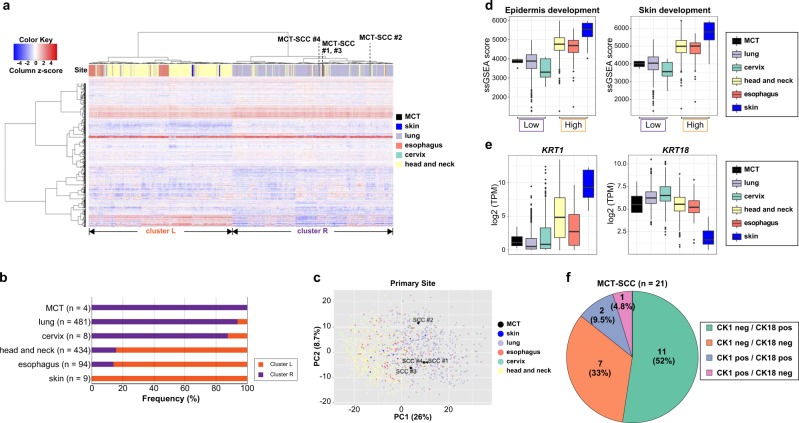
Fig. 3. Similarity among pan-SCCs based on integrated analyses of transcriptomic and immunohistochemistry data.
a A heatmap demonstrates the hierarchical clustering using the top 1000 variable genes in 1030 SCC patients. The color bar and legend show the primary site of the tumor. b The distribution of clusters L and R per tumor type stratified by histological types is shown. c PCA using the variable 1000 genes of 1030 SCC patients is shown. The color and legend in each plot show the primary site of the tumor. d Box plots show ssGSEA score of epidermis development and skin development in different SCCs. e Box plots show log2 TPM of KRT1 and KRT18 in different SCCs. f Pie charts show the number and percentage of CK1/CK18 protein expression evaluated by using immunohistochemistry in 21 MCT-SCCs.

