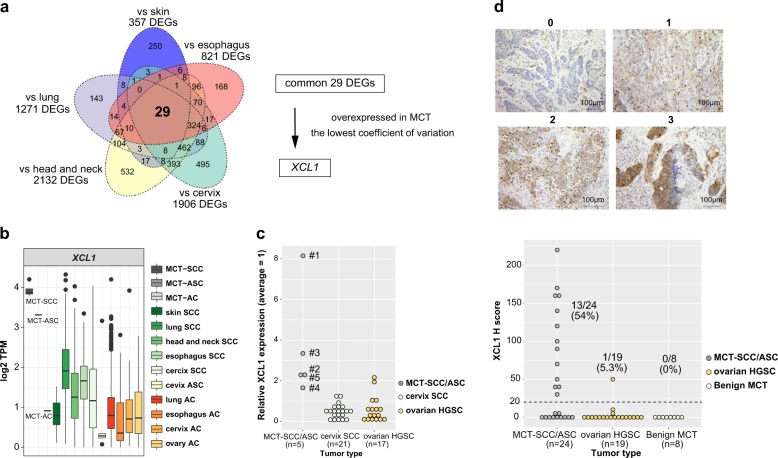
Fig. 4. Identification of XCL1 overexpressed specifically in MCT-SCC.
a Venn diagram shows the number of differentially expressed genes (DEGs) between MCT-SCC and each SCC using TCC based on an FDR q value < 0.05. b Box plots show log2 TPM of XCL1 in different types of SCCs, ASCs, and ACs. c Dot plots show relative XCL1 expression among MCT-SCC/ASC (n = 5), cervix SCC (n = 21), and ovarian HGSC (n = 17) samples by using real-time RT-PCR. d Dot plots show XCL1 expression of MCT-SCC/ASC (n = 24), ovarian HGSC (n = 19), and benign MCT (n = 8) samples evaluated by using immunohistochemistry. The H score was obtained by the following formula: 3 × percentage of strongly stained cytoplasm + 2 × percentage of moderately stained cytoplasm + percentage of weakly stained cytoplasm, giving a range of 0–300. The dotted line indicates the lower cutoff value for a positive result (H score = 20).

