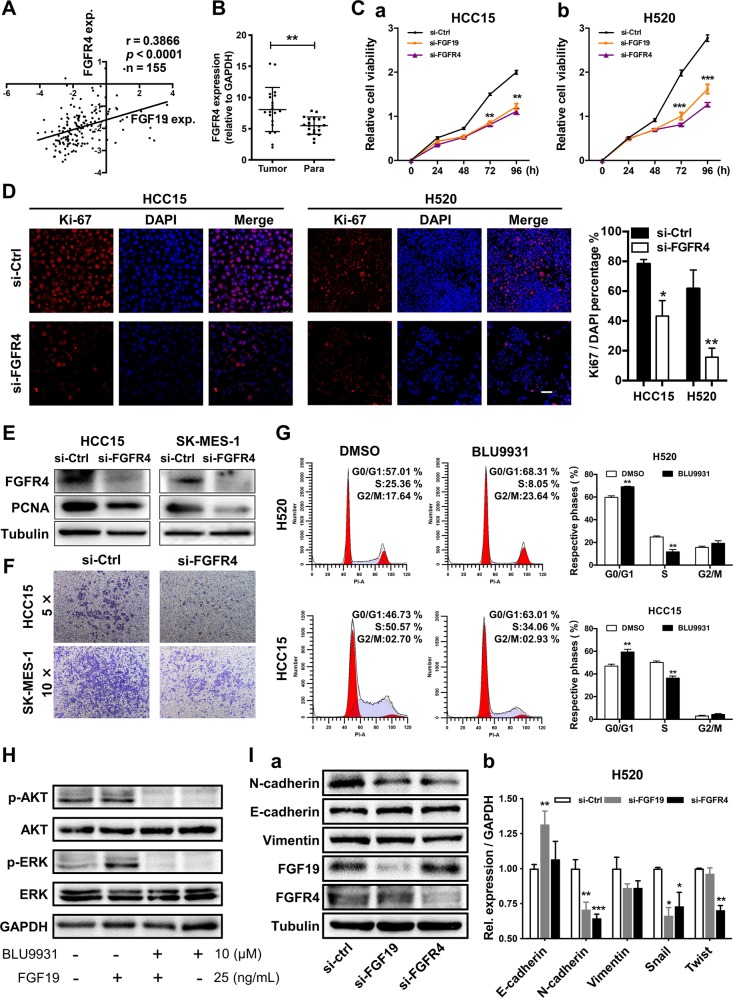
Fig. 5. Downregulation of either FGF19 or FGFR4 suppressed the malignant phenotypes of LSQ cells.
a Analysis of correlation between FGFR4 and FGF19 from Oncomine TCGA datasets. b FGFR4 mRNA levels were determined by q-RT-PCR in 20 LSQ samples relative to the matched non-tumor tissues (normalized to GPADH). c HCC15 (a) and H520 (b) cells were transfected with either control siRNA, FGF19 siRNA or FGFR4 siRNA. CCK-8 assays were conducted to access cell proliferation. d Immunofluorescence staining of Ki-67 (red) and DAPI (for nucleus, blue) in HCC15 and H520 cells after siRNA transfection. Scale bar = 50 µm. The right panel was the percentage of Ki-67 positive cells. e Protein levels of FGFR4 and proliferation marker PCNA were determined by western blot. f Downregulation of FGFR4 suppressed cell migration via trans-well assays in HCC15 and SK-MES-1 cells; g Representative histograms depicting cell cycle profiles of H520 and HCC15 cells with or without FGFR4 inhibitor BLU9931. Right panel: Quantifications of the histograms. h Inhibition of FGFR4 attenuates FGF19- mediated ERK/AKT signaling in H520 cells. i (a) Protein and (b) mRNA expression of EMT markers in the cells transfected with either control siRNA, FGF19 siRNA or FGFR4 siRNA for 48 h in H520 cells. Data were collected from three independent experiments. *p < 0.05; **p < 0.01; ***p < 0.001.

