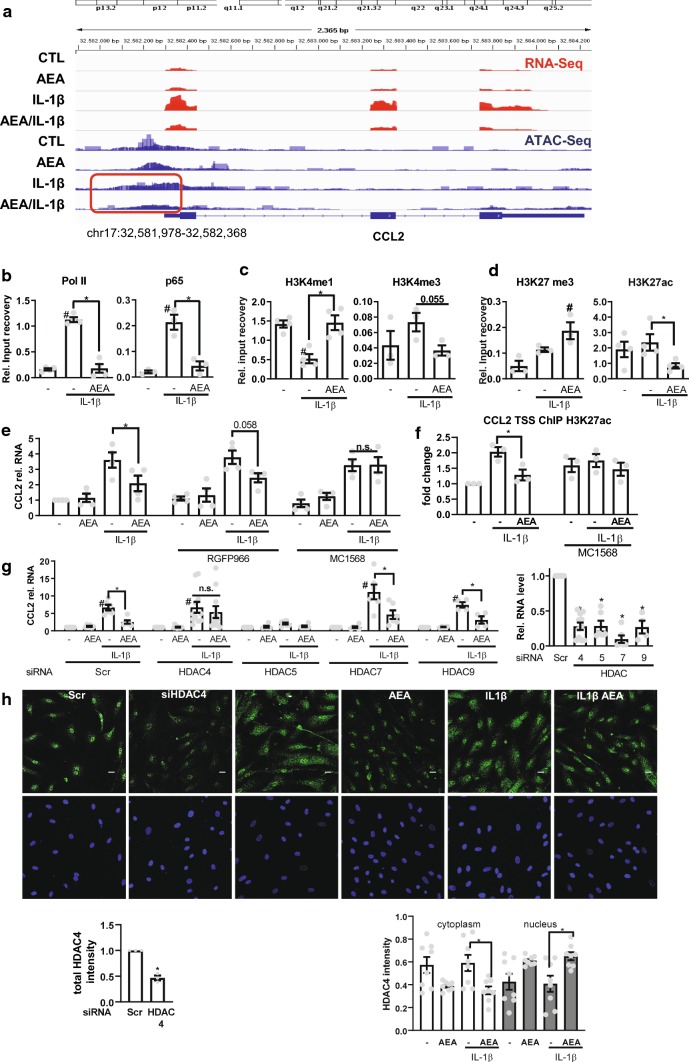
Fig. 4.
AEA-induced CCL2 repression involves HDAC4. a RNA-Seq and ATAC-Seq channel overly tracing of HAoSMC for the stimuli indicated (100 nmol/L AEA, 150 min und 10 ng/mL, IL-1β 90 min). Focusing chromatin structure at the CCL2 Promoter region chr17:32,581,978-32,582,368 in context to IL-1β ± AEA treatment (red box). N = 3 Chromatin immunoprecipitation (ChIP) of the proteins indicated followed by qPCR for the CCL2 transcription start site (TSS) in the absence (b–d) or presence (f) of MC1568 (32 µM). e CCL2 RT-qPCR of HAoSMC pretreated with the HDAC inhibitor RGFP966 (2.7 µM) or MC1568 (32 µM) or solvent (DMSO) for 1 h and afterwards stimulated with AEA (100 nmol/L 150 min) and IL-1β (10 ng/mL 90 min; for ChIP experiments: 120 min 100 nmol/L AEA and 10 ng/mL IL-1β 60 min). Two-way ANOVA with Tukey’s multiple comparison post-hoc test. g CCL2 (left), HDAC (right) RT-qPCR after siRNA knockdown of the HDACs indicated (40 nM, 72 h). Normalized to each siRNA untreated (−). N = 4–11, two-way ANOVA with Tukey’s multiple comparison post-hoc test. h Immunofluorescence of HDAC4 in HAoSMC after treatment with AEA (100 nmol/L, 150 min) and IL-1β (10 ng/mL, 60 min) or HDAC4 siRNA. Scale bar 20 µm, N = 8. Immunofluorescence after siRNA knockdown (40 nM, 72 h) n = 3, unpaired t test. #p < 0.05—vs. treatment, *p < 0.05. Ordinary one-way ANOVA with Tukey’s multiple comparison post-hoc test. If not normally distributed nonparametric ANOVA with Kruskal–Wallis test and Dunn’s multiple comparison post-hoc test

