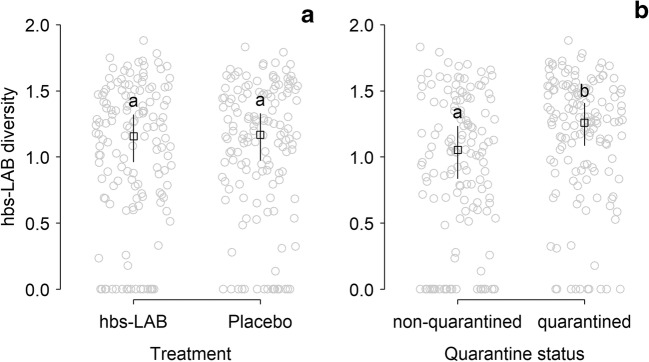
Fig. 2.
Hbs-LAB diversity (Shannon index) found in samples from colonies regarding treatments (A) or quarantine status (B). Different lower-case letters indicate significant differences between predicted marginal means with confidence limits while gray dots represent the original diversity of all sampling occasions of all colonies

