
Figure 2.
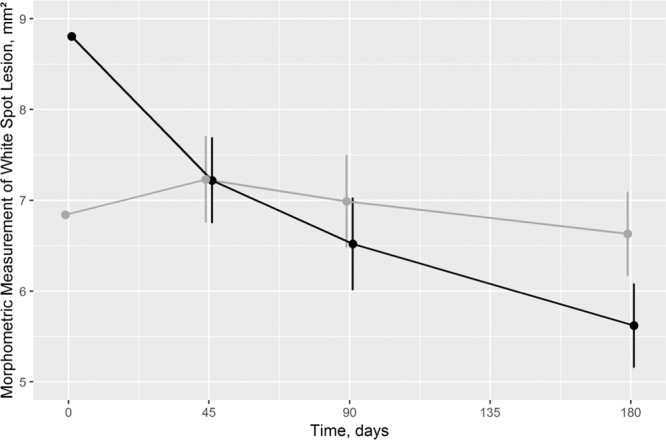
Morphometric measurement of White Spot Lesion Size in mm2 at different time points (black: test tooth/grey: control tooth). As “temporally and logically, a baseline cannot be a response to treatment, so baseline and response cannot be modeled in an integrated framework”43, baseline and response were graphed differently. Consequently, the response and the 95% CI are adjusted for baseline values43. p = 0.969, p = 0.137, and p = 0.004 for treatment differences after 45, 90, and 180 days, respectively.