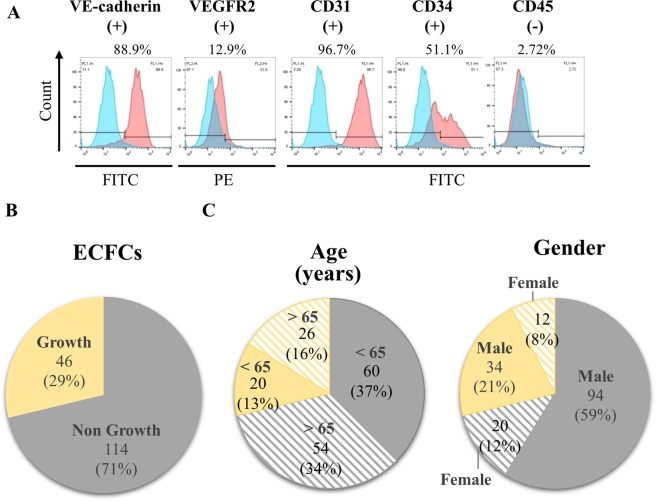
Figure 1.
Isolation and characterization of ECFCs. (A) Representative flow cytometry immunophenotyping of ECFCs confirming the presence of VE-cadherin, VEGFR2, CD31 and CD34 and absence of CD45. Positive cells (%) for each marker are shown in the top of each panel. (B) Pie chart indicating the number and percentage (%) of ECFCs grown from 160 cultures of CAD patient mononuclear cells (MNCs). (C) Comparison of age (left panel) and gender (right panel) of CAD patients with the growth of ECFCs.

