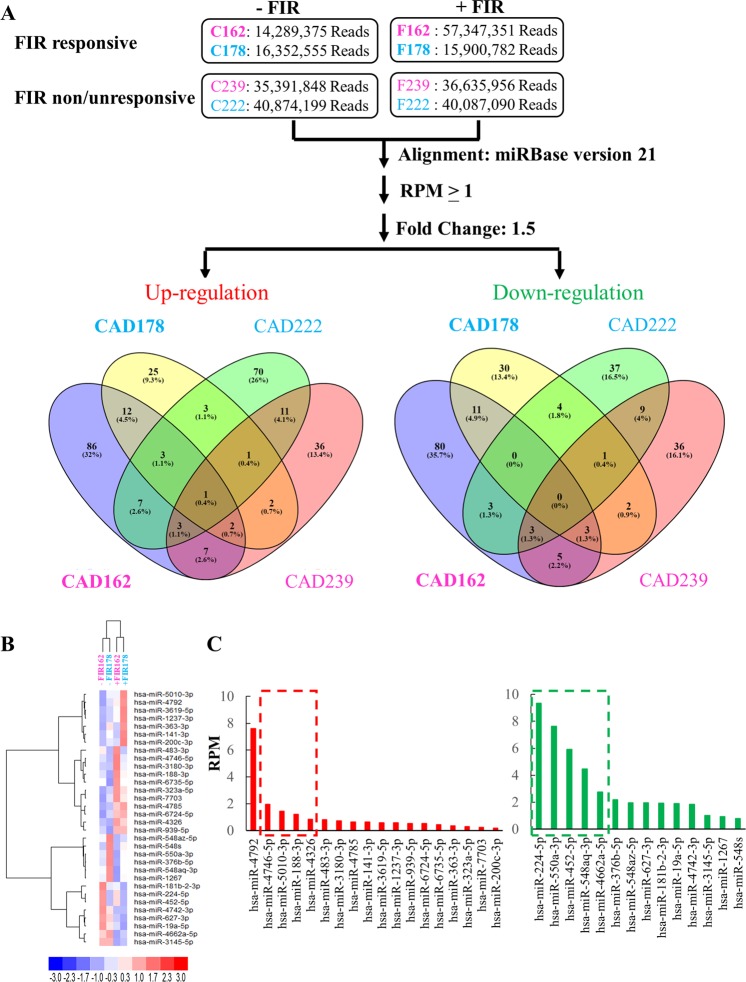
Figure 4.
smRNA-seq data analysis. (A) Flowchart of the miRNA analysis pipeline. Total RNA prepared from Fig. 3A was subjected to smRNA-seq. Read per millions of mapped reads (RPM) higher than 1 in at least one sample were considered as expressed miRNAs and used for fold-change calculations. Venn diagram showing the miRNAs that are up- or down-regulated more than 1.5-fold by FIR treatment. Colors as described in Fig. 3A. (B) Heatmap of hierarchical cluster analysis of miRNAs simultaneously up- (18) and down-(14) regulated in FIR-responsive male and female CAD ECFCs after FIR treatment. (C) Histogram demonstrating the expression level of the FIR up- (left panel) and down- (right panel) regulated miRNAs in (B).

