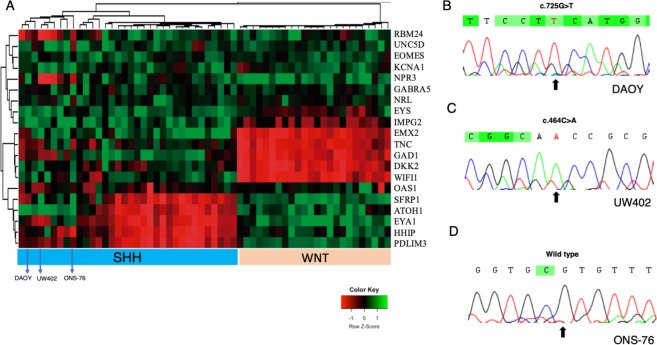
Figure 1.
(A) Hierarchical unsupervised clustering of cell lines DAOY, UW402 and ONS-76 along with medulloblastoma samples assigned as SHH (blue) and WNT (pink) subgroup. Pearson distance followed by average-linkage algorithm was utilized as clustering parameters. (This figure was modified from the original version in Cruzeiro et al., 2019); (B) Eletropherogram of TP53 mutation loci in DAOY cell line (c.725G > T); (C) Eletropherogram of TP53 mutation loci in UW402 cell line (c.464C > A) (D) Eletropherogram of TP53 Wild-type loci in ONS-76 cell line.

