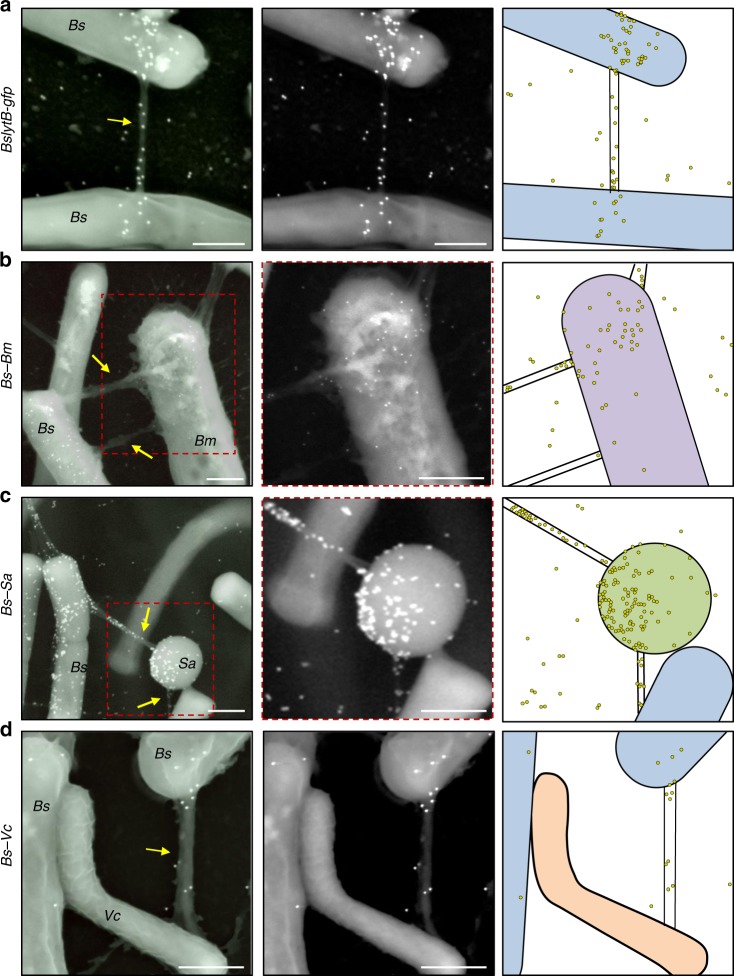
Fig. 3. LytB molecules travel along intercellular nanotubes to reach the recipient cell surface.
a Bs cells expressing LytB-GFP (AB144: lytB-gfp, ΔymdB, amyE::Phyper-spank-ymdB, Δhag) were spotted onto EM grids and subjected to immuno-gold XHR-SEM analysis, using primary antibodies against GFP and secondary gold-conjugated antibodies. Samples were not coated before observation. Shown is an overlay of XHR-SEM images acquired using TLD-SE (through lens detector-secondary electron) for nanotube visualization and vCD (low-kV high-contrast detector) for gold particle (white dots) detection (left panel), and the corresponding vCD image (middle panel). Schematic depicts the interpretive cell layout and highlights the region with gold signal captured by XHR-SEM (right panel). b Bs cells expressing LytB-GFP (AB170: lytB-gfp, ΔymdB, amyE::Phyper-spank-ymdB, Δhag, ∆wapA) were mixed with Bm (OS2, lacking GFP), spotted onto EM grids and subjected to immuno-gold XHR-SEM as described in a. Shown is an overlay of XHR-SEM images acquired using TLD-SE for nanotube visualization and vCD for gold particle (white dots) detection (left panel), and a corresponding vCD image of the boxed region (middle panel). Schematic depicts the interpretive cell layout and highlights the region with gold signal captured by XHR-SEM (right panel). c Bs cells expressing GFP tagged LytB (AB144: lytB-gfp, ΔymdB, amyE::Phyper-spank-ymdB, Δhag) were mixed with Sa (MRSA, lacking GFP), spotted onto EM grids and subjected to immuno-gold XHR-SEM as described in a. Shown is an overlay of XHR-SEM images acquired using TLD-SE for nanotube visualization and vCD for gold particle (white dots) detection (left panel), and a corresponding vCD image of the boxed region (middle panel). Schematic depicts the interpretive cell layout and highlights the region with gold signal captured by XHR-SEM (right panel). d Bs cells expressing GFP tagged LytB (AB144: lytB-gfp, ΔymdB, amyE::Phyper-spank-ymdB, Δhag) were mixed with Vc (N16961, lacking GFP), spotted onto EM grids and subjected to immuno-gold XHR-SEM analysis as described in a. Shown is an overlay of XHR-SEM images acquired using TLD-SE for nanotube visualization and vCD for gold particle (white dots) detection (left panel), and the corresponding vCD image (middle panel). Schematic depicts the interpretive cell layout and highlights the region with gold signal captured by XHR-SEM (right panel). Each experiment was repeated at least five times independently with similar results. Scale bars represent 500 nm. Arrows indicate intercellular nanotubes.

