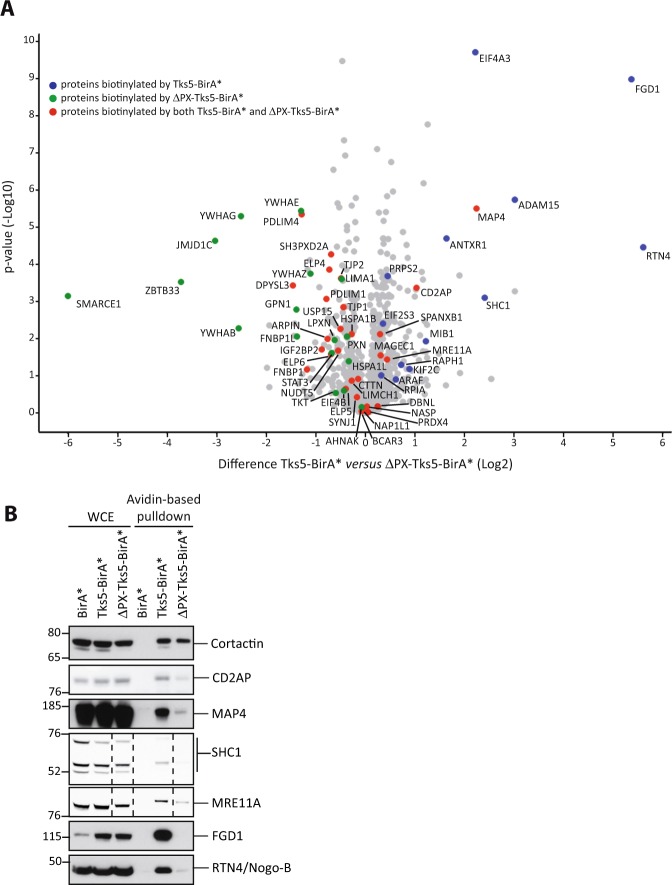
Figure 4.
Invadopodia components show different modes of interaction with Tks5. MDA-MB-231 cells expressing Tks5-BirA*, ΔPX-Tks5-BirA* or BirA* were seeded on gelatin-coated plates and treated with biotin for 16 h. Biotinylated proteins were isolated by affinity capture and identified by mass spectrometry. (A) Volcano plot showing the differential level (Log2) and the p-value (-Log10), on x and y axis, respectively, for Tks5-BirA* versus ΔPX-Tks5-BirA*, without taking into account proteins identified as biotinylated in BirA* control condition. Data result from two different experiments processed three times. Proteins biotinylated by Tks5-BirA*, by ΔPX-Tks5-BirA* and by both Tks5-BirA* and ΔPX-Tks5-BirA*, relative to the BirA* control condition, are highlighted in blue, green and red, respectively. For more details refer to Supplementary Table S3. (B) Verification of the biotinylation levels induced by Tks5-BirA* or ΔPX-Tks5-BirA*, of selected proteins identified in (A). The presence of proteins of interest was assessed in whole cell extract (WCE) or after avidin-based pulldown followed by western blotting with the indicated antibodies. Dotted lines indicate that the disposition of the lanes has been reorganized, but that lanes are from a single blot and are therefore directly comparable. Full-length blots are presented in Supplementary Fig. 2.

