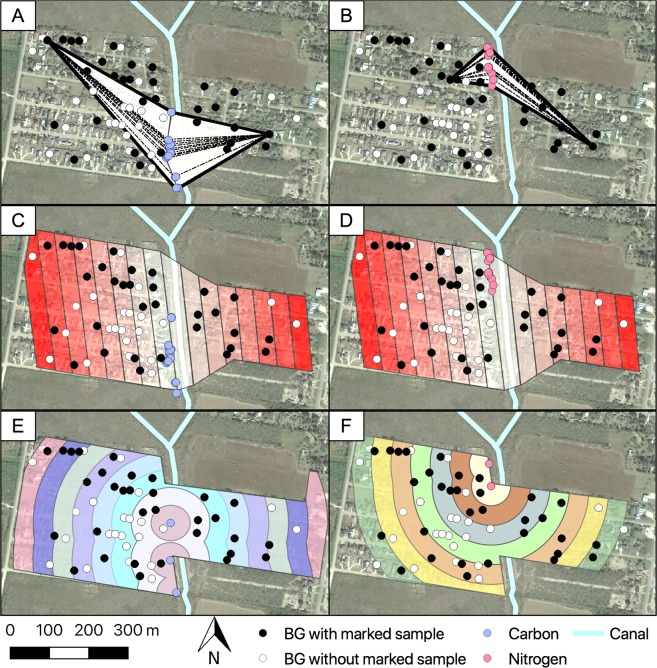
Figure 5.
Mean distance traveled approaches used for the estimation of the natural dispersion of isotopically marked mosquitoes. (A,B) Net approach measurements were based on the mean distance of the house with a marked sample to every larval source enriched. (C,D) Strip approach and (E,F) Circular approach averages the max and min distance for all houses per sector, taking into account indirect flight patterns and trap densities. Dotted lines = distance from larval enriched source to house with marked sample. The map was developed using QGIS 3.4.4 (https://qgis.org/en/site/) with Map data: Google, Maxar Technologies.

