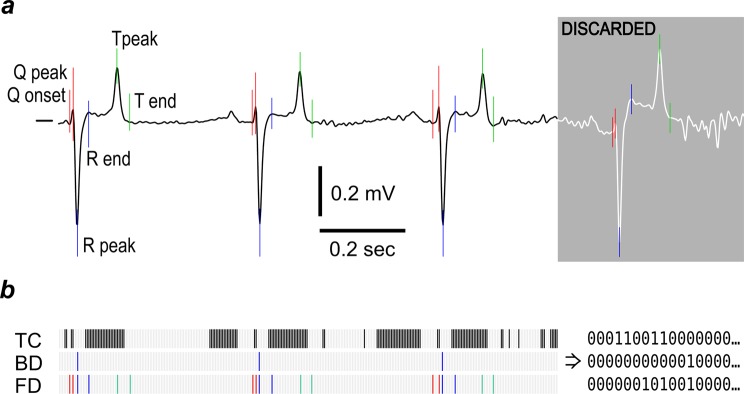
Figure 4.
Methods of equine ECG coarse-graining. (a) Cardinal points selected for complexity analysis. The greyed part of the plot shows a typical part of the ECG that was rejected for low signal quality. (b) Coarse-graining methods used for complexity analysis: TC - threshold crossing; BD - beat detection; FD - feature detection. Zero values are shown as white bars, unitary values as black or coloured bars. Note that the FD method captures significantly more information on the waveform shape than BD while being less sensitive to noise than the TC method.

