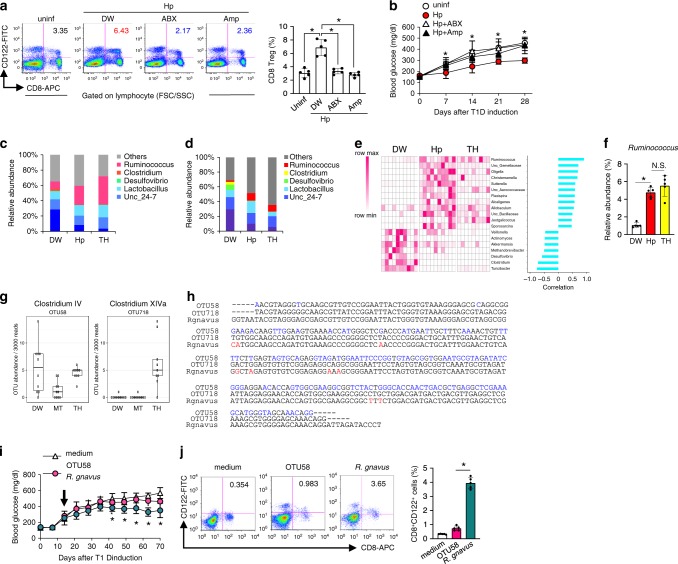
Fig. 3. Microbiota induces of CD8+ Treg cells during Hp infection.
a, b Hp-infected mice treated with an antibiotic mixture (ABX), ampicillin (Amp), or untreated (DW) were used for T1D induction. CD8+ Treg cells (a), and blood glucose (b) were analysed as in Fig. 1d and a, respectively. Values represent the mean ± SD of five mice. The microbiota composition at genus levels of the small intestines (c) and faeces (d) of indicated mice at 14 days after infection or feeding. Values represent the mean of 10 (DW, Hp) or 9 (TH) mice. e Heatmap showing the abundance of genera of faecal bacteria correlated with the frequency of CD8+ Treg cells in mice used in d as depicted in the colour scale (left panel). Each column represents an individual animal. The positive correlation is strongest from the top (Ruminococcus) to the 12th row (Sporosarcina), and the negative correlation is strongest from the bottom (Turicibacter) up to the 13th row (Veillonella) (right panel). f Frequency of Ruminococcus among whole intestinal bacteria in the indicated mice re-evaluated by quantitative PCR. g Abundance of OTU (operational taxonomy unit) 58 and OTU718 in mice fed with TH were measured. Values represent the mean ± SD of five mice. h Partial DNA sequences of 18S rRNA of Ruminococcus gnavus, OTU58, and OTU718. Eight different nucleotides out of 257 between R. gnavus and OTU718 are depicted in red, and those between OTU58 and OTU718 (119/254) are depicted in blue. i Glucose levels were monitored in STZ-treated mice orally inoculated with OTU58 or R. gnavus. Values represent the mean ± SD of five mice. j Frequencies of CD8+ Treg cells among spleen cells cultured in the presence of culture supernatant from OTU58 or R. gnavus for 48 h were analysed by flow cytometry. Numbers in pseudocolor plots indicate the percentages of CD8+ Treg cells summarised as a bar graph. Values represent the mean ± SD of five mice. Asterisks denote statistical significance at p < 0.05 calculated by Tukey post-hoc analysis (a, f, j), two-way ANOVA (b, i). All experiments were repeated at least three times with similar results.

