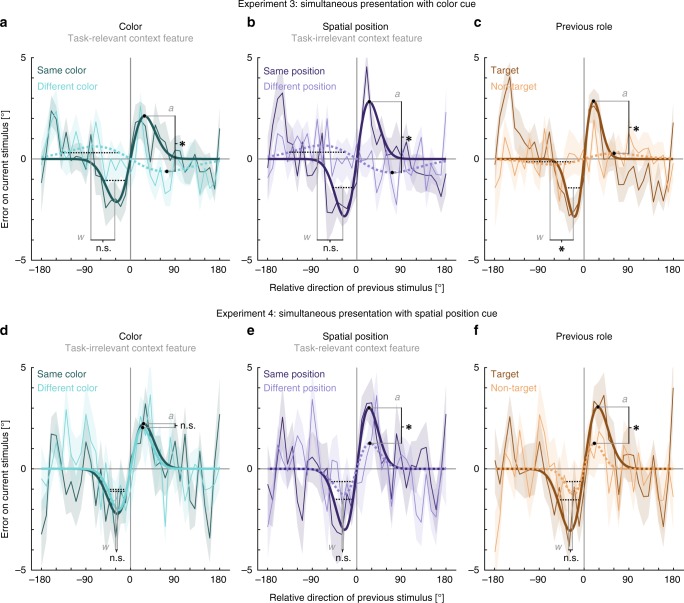
Fig. 5. Results of Experiments 3 and 4.
Serial dependence (ordinate) is shown as a function of the motion direction difference (abscissa) between an item of the previous trial and the target of the current trial (Experiment 3: panels a–c, Experiment 4: panels d–f). For details, see Fig. 2 and Methods. Serial dependence was revealed by the group averages of response errors (thin lines), with the corresponding shaded regions depicting the standard error of the group mean. A DoG model (shown as bold lines) was fitted to the response errors to estimate the systematic response bias. Solid lines indicate a significant bias, whereas dashed lines depict a non-significant bias. Black filled circles and black dashed lines show the amplitudes and FWHMs of the DoG fits and are accompanied by a symbol indicating the result of the direct comparison of the parameter estimates (one-sided permutation tests, 20 participants per Experiment). Asterisks indicate a p-value < 0.05 and ‘n.s.’ indicates a non-significant result with a p-value ≥ 0.05. a Serial dependence was observed between items with the same color, but not between items with different colors (amplitude difference: p = 0.005, width difference: p = 0.153). b Serial dependence was observed between items with the same spatial position, but not between items with different spatial positions (amplitude difference: p < 0.001, width difference: p = 0.154). c Serial dependence was observed from a target of the previous trial, but not from a previous non-target (amplitude difference: p = 0.003, width difference: p = 0.012). d Serial dependence was observed both for items with the same color and different colors, with no difference between both conditions (amplitude difference: p = 0.434, width difference: p = 0.284). e Serial dependence was observed between items with the same spatial position, but not between items with different spatial positions. (amplitude difference: p = 0.005, width difference: p = 0.379). f Serial dependence was observed from a target of the previous trial, but not from a previous non-target (amplitude difference: p = 0.010, width difference: p = 0.148). Source data are provided as a Source Data file.

