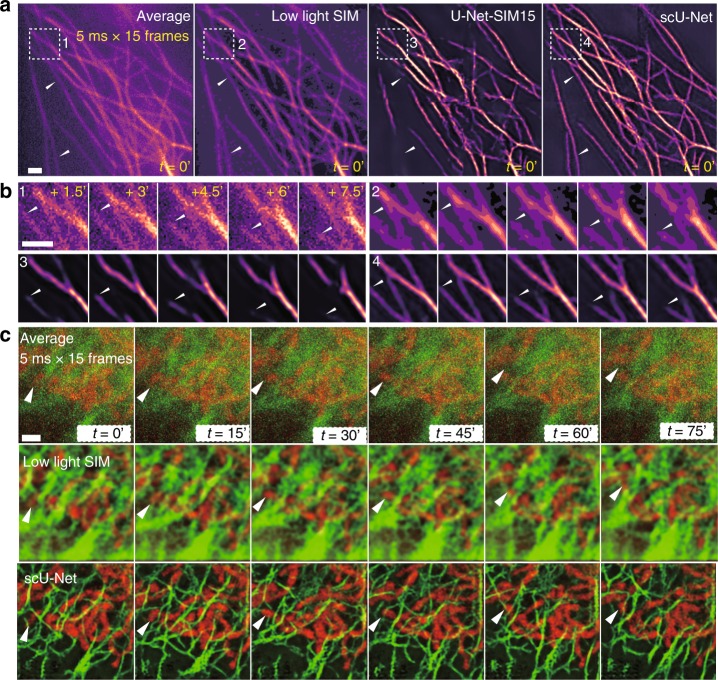
Fig. 3. scU-Net for live-cell imaging.
a Reconstruction results for microtubules in living cells. A representative time point is shown. The missing structures from U-Net-SIM15 were recovered by scU-Net (white arrows). First panel shows the average projections of 15 SIM raw images; second panel shows the SIM reconstruction; third panel shows the U-Net-SIM15 output; fourth panel shows the scU-Net output. n = 3, from three independent experiments. b Enlarged views of areas indicated by the white-dashed box in a are shown. The dynamics of a single microtubule (white triangle) was well restored by scU-Net. c scU-Net reveals the dynamics of microtubule–mitochondria interactions. First row: average projections of 15 SIM raw images; second row: SIM reconstruction; third row: scU-Net output. n = 3, from three independent experiments. Scale bar: 1 μm.

