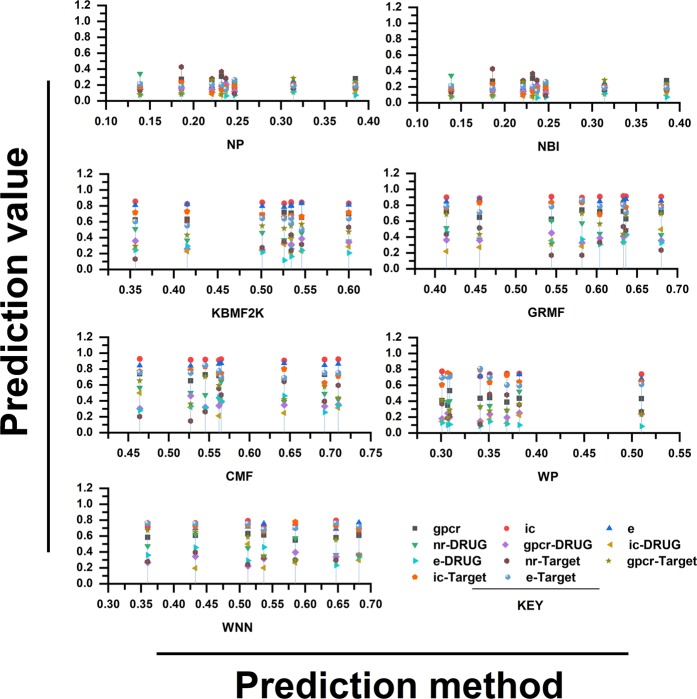
Figure 2.
Depicts the DTIs prediction using different methods, X-axis represents the applied methods and Y-axis indicates the DTIs’ prediction scores. All the methods (NP (Nearest Profile), NBI (Network-based inference), KBMF2K (Kernelized Bayesian Matrix Factorization with Twin Kernels), WGRMF (Weighted Graph Regularized Matrix Factorization), CMF (Collaborative Matrix Factorization (CMF), WP (Weighted Profile), and WNN (Weighted Nearest Neighbors)) show approximately same prediction score with minor changes except WGRMF that achieved comparatively highest value. The NP and NBI approach exhibits comparatively much lower prediction scores.

