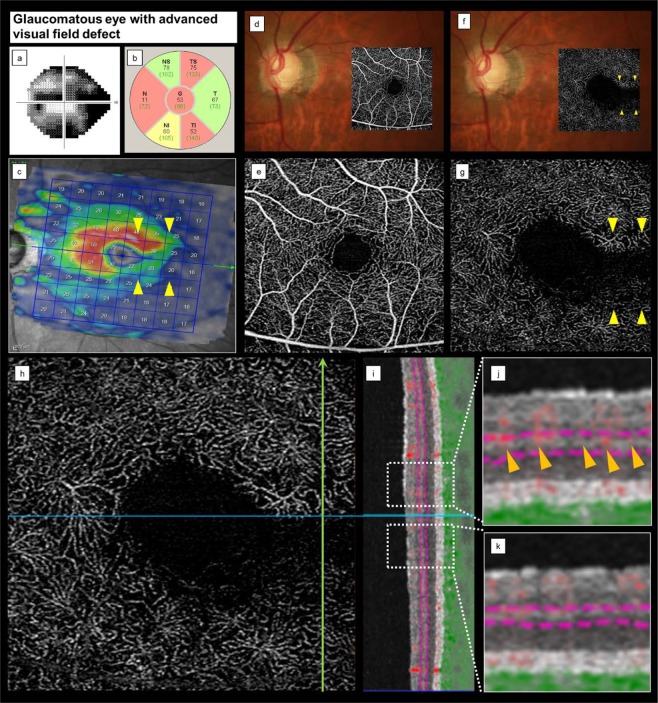
Figure 3.
Representative case of a glaucomatous eye with advanced visual field loss. (a) VF testing shows an advanced VF loss. (b,c) A fundus photograph superimposed on an OCTA en face image shows superior and inferior temporal cpRNFL and inferior mGCL thinning corresponding to VF loss. These findings indicate glaucomatous optic neuropathy. (d,e) The colour fundus photograph and the SRL OCTA image do not show signs of microvascular changes. (f,g) The DRL OCTA image shows apparent vertical ADRVD (yellow arrowheads) and the corresponding ADRVD, GCL thinning, and central VF loss locations. (h,i) An OCTA image shows the location, in which a vertical line scan (h, green arrow) of the microvasculature was obtained. (j,k) Magnified views are also shown by the white squares. The red shading indicates the blood flow. The SRL microvascular signal is intact, but the DRL microvascular signal is reduced (yellow arrowheads). cpRNFL, circumpapillary retinal nerve fiver layer; mGCL, macular ganglion cell layer; VF, visual field; OCTA, optical coherence tomography angiography; ADRVD, vertical asymmetrical deep retinal vessel density reduction; DRL, deep retinal layer; SRL, superficial retinal layer.

