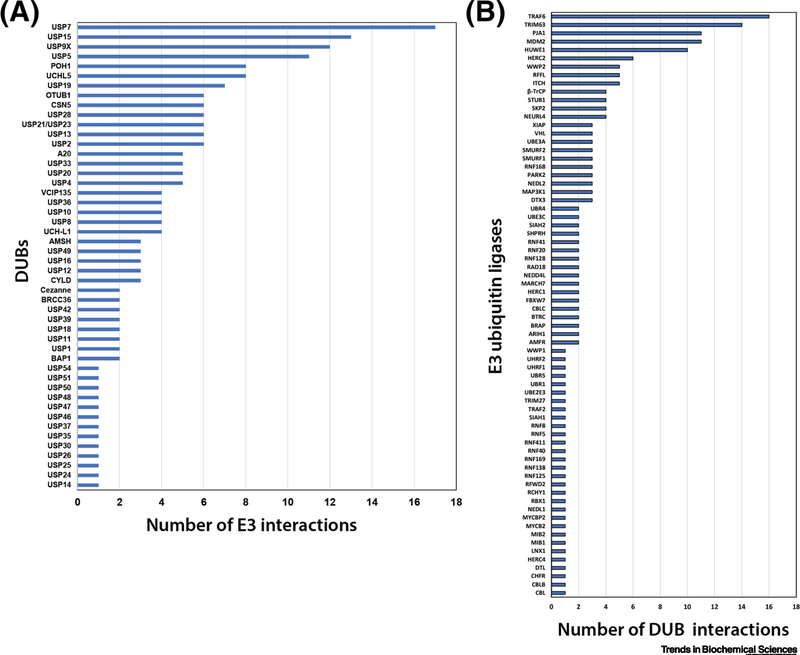
Figure 1.
Prevalence of DUB-E3 interactions reported in human cells. A complete catalog of reported human DUB-E3 interactions curated on BioGrid (https://thebiogrid.org/) is provided in Table S1. (A) For each DUB in the DUB-E3 interaction catalog, the number of distinct E3 interactions is plotted. (B) For each E3 in the DUB-E3 interaction catalog, the number of distinct DUB interactions is plotted. A complete listing of these interactions is provided in Table S1.

