Figure 2.

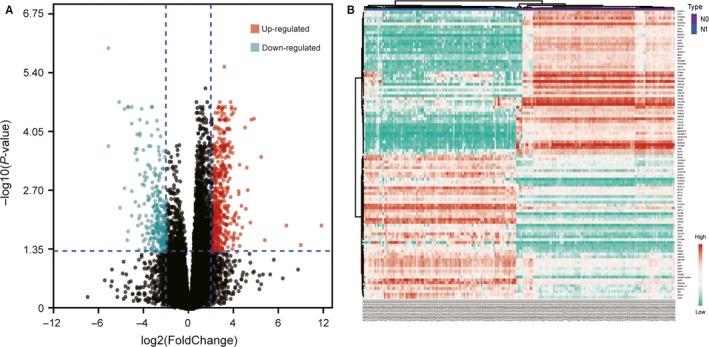
Selection of DEGs. A, Volcano plot of the DEGs (adjust P‐value < .05 and |logFC| ≥2 were set as the cut‐off criteria). B, Heat map of the top 100 DEGs (top 50 up‐regulated and down‐regulated genes). DEGs, differentially expressed genes

Selection of DEGs. A, Volcano plot of the DEGs (adjust P‐value < .05 and |logFC| ≥2 were set as the cut‐off criteria). B, Heat map of the top 100 DEGs (top 50 up‐regulated and down‐regulated genes). DEGs, differentially expressed genes