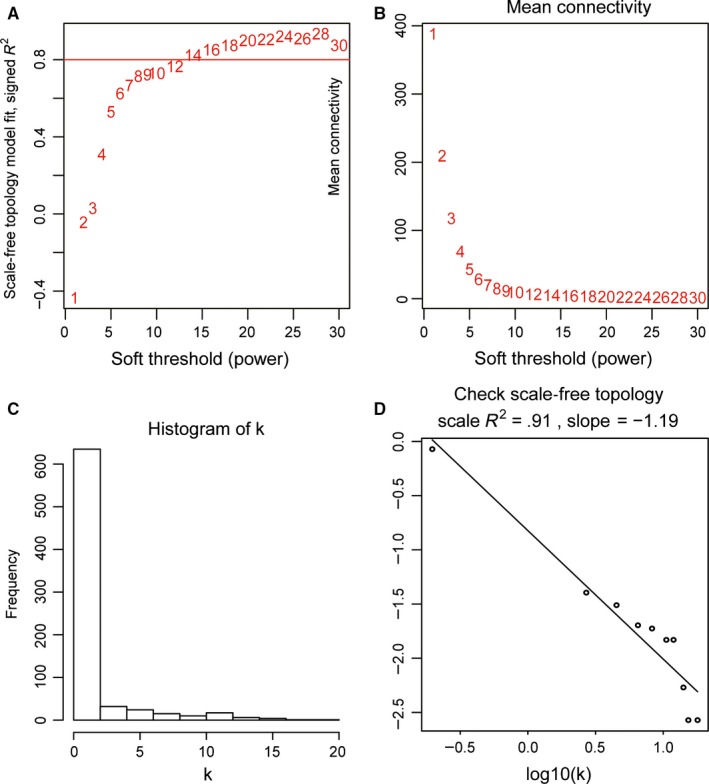
Figure 3.

Determination of soft‐thresholding power in WGCNA. A, Analysis of the scale‐free fit index for various soft‐thresholding powers. B, Analysis of the mean connectivity for various soft‐thresholding powers. C, Histogram of connectivity distribution when β = 14. D, Check of scale‐free topology when β = 14. WGCNA, Weighted gene co‐expression network analysis
